


Related Tags
Watching a stock or currency pair slide lower for days can test any trader’s patience. Just when sellers seem firmly in control, a session opens slightly higher and prints a small green candle tucked entirely inside the prior day’s steep drop. That quiet pause is what technical analysts call a bullish harami, and it often signals that downward momentum may be losing steam.
What Is a Bullish Harami Candlestick and How Does It Form?
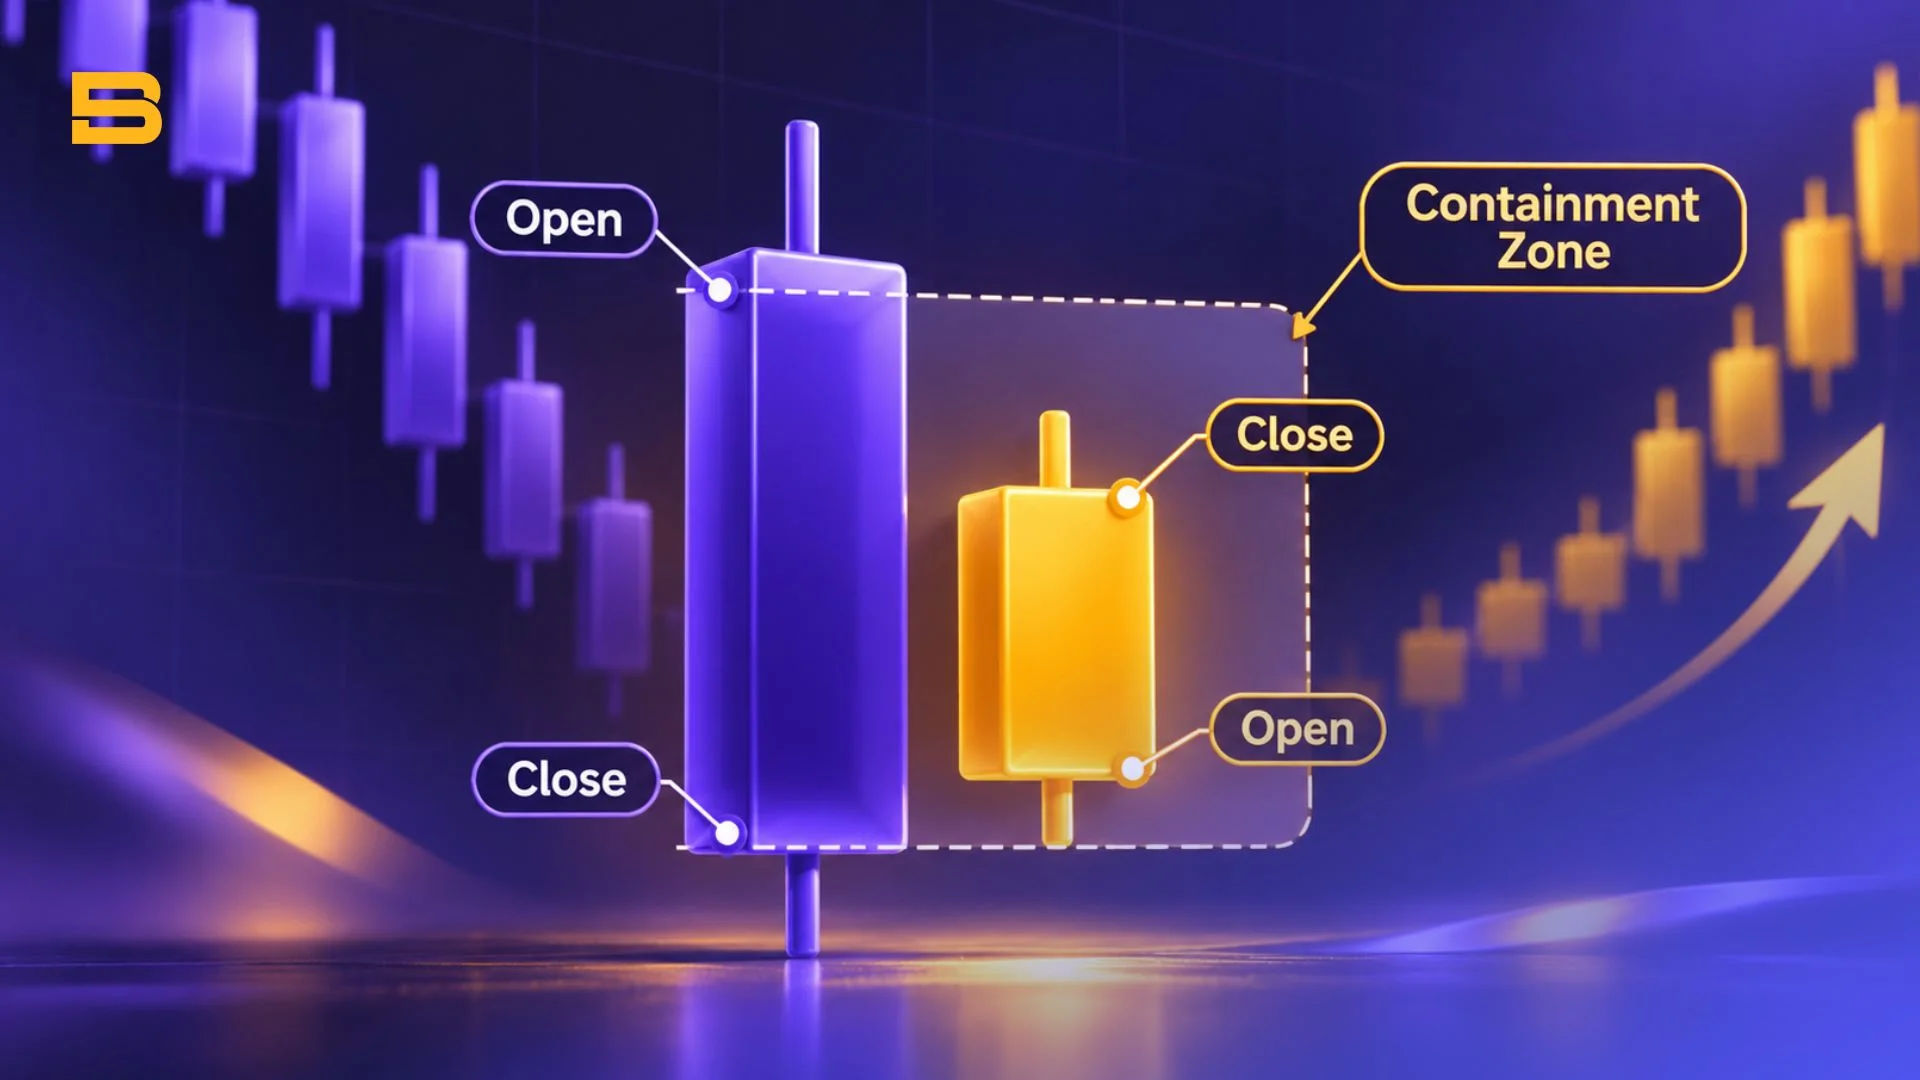
A bullish harami candlestick is a two-candle reversal pattern where a small bullish body forms completely inside a preceding large bearish candle. The Japanese word harami translates to “pregnant,” reflecting how the tall first candle visually encloses the smaller second candle.
During an active downtrend, the first candle opens near its high and closes sharply lower, sometimes resembling a bearish marubozu candlestick with almost no wicks. Sellers dominate that session, pushing price down with conviction and leaving buyers on the sidelines.
On the following session, price gaps up slightly at the open and trades within a narrow range before closing higher than it opened. Because the second candle’s real body stays strictly between the open and close of the first candle, the pattern shows that aggressive selling pressure has stalled. However, a slowdown in selling does not automatically mean buyers have taken over, so traders treat this formation as an early warning rather than an automatic buy trigger.
Bullish Harami vs. Bullish Harami Cross
When the second candle has virtually the same open and close price, forming a cross-like shape instead of a small green body, the pattern becomes a bullish harami cross. This variation highlights even stronger market indecision because neither buyers nor sellers managed to push the close away from the open.
In some cases, that second candle takes the shape of a dragonfly doji, showing that sellers briefly drove prices lower intraday before buyers pushed them back up to the opening level. While a harami cross can signal a sharper shift in sentiment than a standard harami, it still carries the risk of failing if fresh selling arrives on the third candle.
How to Identify a Bullish Harami Pattern Step by Step
Spotting a candlestick pattern accurately requires checking the surrounding price context rather than isolating two candles on a blank screen. Following a structured checklist helps filter out random sideways noise during a volatile market:
- Confirm an existing downtrend: Look for a clear series of lower highs and lower lows leading into the formation, ideally approaching a known support zone.
- Verify the first candle’s bearish body: The initial candle should be noticeably larger than recent sessions, reflecting strong downward momentum.
- Check complete body containment: The second candle must be bullish (green or white) with both its open and close sitting strictly inside the vertical span of the first candle’s real body.
- Filter using higher timeframes: Patterns appearing on four-hour or daily charts tend to carry more weight than those on five-minute charts, where low-liquidity fluctuations create frequent false signals.
Look for supporting clues around the same price area, such as a tweezer bottom pattern or a piercing line pattern forming nearby on a higher timeframe. Combining multiple price-action cues gives you a clearer picture of whether buyers are genuinely defending that level.
Bullish Harami vs. Bullish Engulfing and Inside Bar Patterns
Beginners often confuse this pattern with other two-candle formations that share similar visual traits. Comparing their exact body rules makes it easier to separate a subtle pause from an aggressive momentum shift. A bullish engulfing pattern reverses that relationship: its green second body is larger than the prior red body and fully covers it, which can point to a more aggressive shift in momentum.
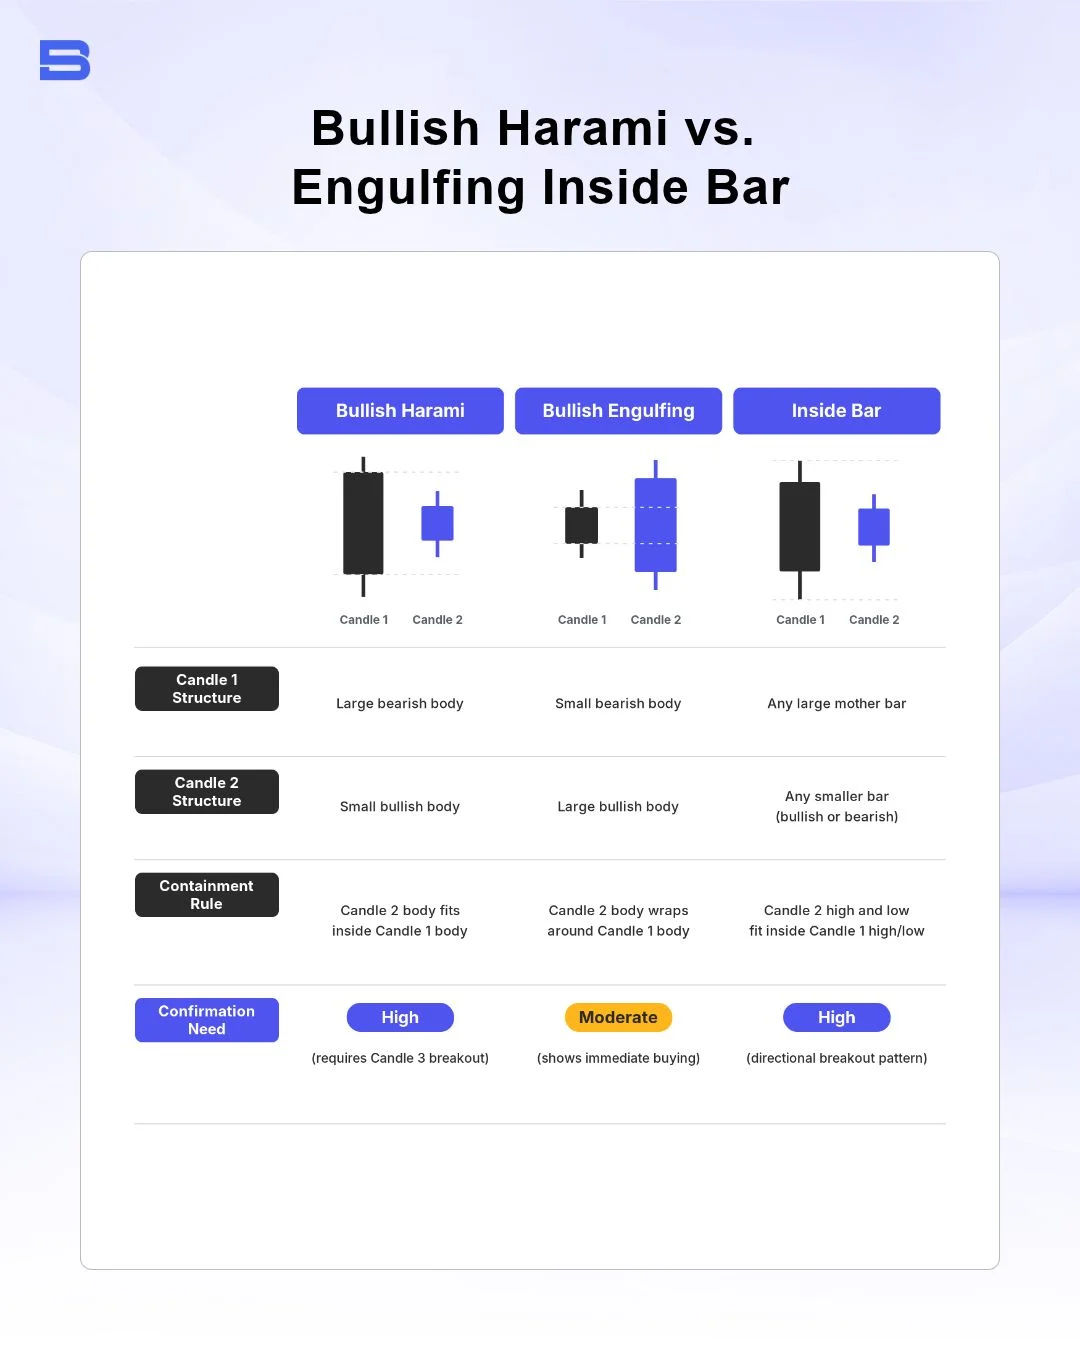
While an inside bar candlestick measures full high-to-low range containment regardless of candle color, a bullish harami focuses specifically on the open-to-close real bodies. Single-candle reversal signals such as a pin bar or inverted hammer rely on long price rejection wicks rather than two-candle body compression.
Bullish Harami vs. Bearish Harami
A bearish harami is the exact mirror image of the bullish version and appears after a sustained uptrend. It begins with a tall green candle followed by a small red candle tucked inside the prior body, warning that upward momentum may be fading.
Traders watching for market tops often pair a bearish harami with other downside warning signs, such as dark cloud cover or a gravestone doji at resistance. Recognizing both versions helps you avoid chasing trends right as momentum begins to stall.
How to Trade a Bullish Harami Setup With Confirmation and Risk Controls
Waiting for objective confirmation, rather than jumping in at the close of the second candle, can help you filter out some false signals. Many price-action traders wait for a third candle to break above the high of the first bearish candle, which shows that buyers can push price higher.
To see how this works in practice, imagine a stock sliding in a steady downtrend before printing a large bearish candle that opens at $50.00 and closes at $48.00. The next day, the stock opens at $48.30 and closes at $48.90, forming the pattern inside the prior body.
Rather than buying immediately at $48.90, you set a buy stop order at $50.10, just above the first candle’s high, and place a protective stop-loss at $47.80 below the pattern’s lowest point. If you have a $10,000 account and cap your risk at 1% ($100), your $2.30 risk per share ($50.10 minus $47.80) limits your position to 43 shares, with a 1:2 reward target at $54.70. In practice, spreads and commissions add to that $2.30 risk per share, so including them in your calculation may reduce your position size slightly.
Even with confirmation, a candlestick pattern can turn into a continuation pause trap where price consolidates briefly before plunging to new lows. Slippage during fast sell-offs can also push your actual fill below a stop-loss order, so keeping position sizes modest and following your trading plan rules remain essential. Following the CFA Institute’s emphasis on thorough, evidence-based investment analysis and guidance on retail investor risk awareness from the International Organization of Securities Commissions (IOSCO) helps traders maintain realistic expectations and make more informed decisions.
Conclusion
The bullish harami offers a useful early clue that a downtrend may be losing momentum, especially when it forms near established support on higher timeframes. Pairing the pattern with third-candle confirmation, strict stop-loss placement, and disciplined position sizing helps you manage downside risk when market reversals fail.
- How to Build an Investment Plan That Actually Works for You?
- What Is the MACD Indicator and How to Use It
- What Is a Wedge Pattern in Trading?
- What Is Ichimoku Cloud Strategy? A Complete Trading System
- Mastering Elliott Wave Theory: Rules and Trading Strategies
- News Trading: Strategies, Execution Risks, and Risk Control
- What Is an Iron Condor Options Strategy?
- Backtesting Explained: What It Is and Why It Really Matters
- Grid Trading: Mechanics, Parameters, and Risk Strategies
- What Is Breakout Trading and How Does It Work?
- Mean Reversion: Technical Strategies and Risk Frameworks
- Momentum Trading: Indicators, Strategies, and Risk Control
- Hammer Candlestick: Structure, Meaning, and Strategy
- Doji Candlestick: Types, Signals, and Trading Strategies
- What Is the Sharpe Ratio and How to Calculate It
- What Is VWAP and How Do Traders Use It?
- Trade the Ascending Triangle: A Step-by-Step Practical Guide
- What Is the Stochastic Oscillator and How to Use It
- How to Trade the Descending Triangle Pattern
- High Frequency Trading: Speed, Algorithms, and Market Impact
- What Is Volume Profile and How to Use It in Trading
- What Is a Morning Star Pattern Candlestick?
- Trade with Parabolic SAR: A Practical Analysis Guide
- Evening Star Pattern: Structure, Rules, and Risk Controls
- Kelly Criterion: Formula, Position Sizing, and Risk
- What Is the NYSE Minimum Trading Price? Rules Explained
Disclaimer: The content on this page is intended for educational and informational purposes only. It does not constitute financial, investment, tax, or legal advice, and should not be interpreted as a recommendation to buy, sell, or hold any financial instrument or asset. Trading and investing involve significant risk, including the possible loss of your entire capital. Products such as forex, CFDs, and cryptocurrencies carry additional risks due to leverage, high volatility, and limited regulatory protection in some jurisdictions. Past performance of any financial instrument does not guarantee future results. Any market views, forecasts, or opinions expressed are those of the author at the time of writing and may not reflect current market conditions. Platform features, fees, and regulatory status are subject to change — always verify information directly with the relevant provider or regulator before making any financial decision. BrokerSpecs may receive compensation from third parties featured on this site. Always conduct your own due diligence and consider seeking advice from a licensed financial professional before investing. Portions of this article were prepared with the assistance of AI tools and reviewed by our editorial team before publication.