


Related Tags
You open your trading platform and add several tools to the chart, only to end up with a confusing mess of signals. One indicator suggests a strong buy, another warns of a potential sell-off, while a third shows a sideways market. Instead of creating clarity, too many indicators can leave you uncertain. Using the best trading indicators can help simplify your analysis and focus on the signals that matter most.
Technical indicators are essential analytical tools, but using too many—or using the wrong combination—can easily lead you to second-guess valid setups. Mastering technical analysis isn't about crowding your chart with dozens of overlay lines. It is about selecting a balanced set of complementary indicators that work together without creating false signals.
So which are the best trading indicators? For most beginners, a strong starting toolkit includes the Relative Strength Index (RSI), Moving Average Convergence Divergence (MACD), Bollinger Bands, Fibonacci retracement, and Average True Range (ATR), with Volume Weighted Average Price (VWAP) and short-term exponential moving averages (EMAs) added for day trading. No single tool works on its own; the goal is to pair two or three that each do a different job.
Best Trading Indicators: A Beginner's Guide to the Most Popular Tools
At their core, technical analysis indicators are mathematical calculations based on historical price, volume, or open interest (the number of futures or options contracts still open). The best trading indicators transform raw market data into visual signals that can help traders identify emerging trends, assess momentum, and measure volatility. However, no indicator can predict price movements with complete certainty; they are tools for assessing probabilities, not forecasting the future.
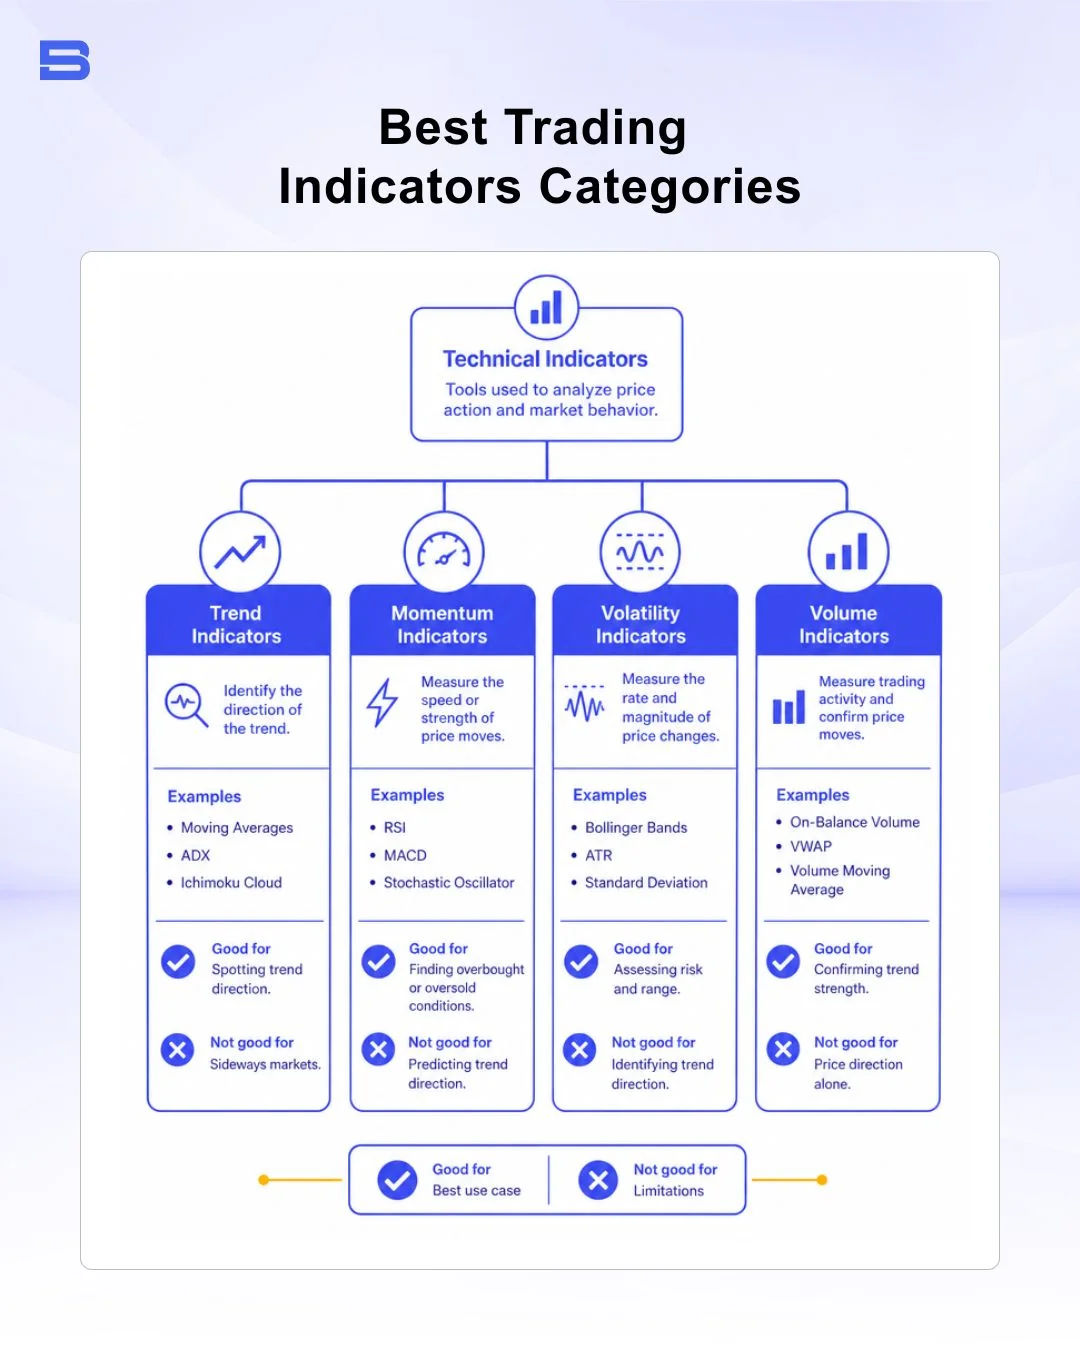
To build a reliable system, you must categorize indicators by their underlying function. Technical tools generally fall into four core groups:
- Trend Indicators: Identify the overarching direction of the market (e.g., Moving Averages).
- Momentum Oscillators: Measure the speed of price movements and highlight overbought or oversold conditions (e.g., RSI, Stochastic).
- Volatility Indicators: Track market range expansion and contraction (e.g., Bollinger Bands, ATR).
- Volume Indicators: Evaluate the institutional conviction behind price movements (e.g., VWAP and Volume Profile, which shows how much trading happened at each price level).
Understanding Indicator Lag and Avoiding Redundancy
A common trap for developing traders is indicator redundancy—placing three tools on a chart that do the same job. For example, pairing a Relative Strength Index (RSI) with a Stochastic Oscillator and Williams %R provides three separate lines calculated from momentum, giving you a false sense of confirmation when they all align.
You should also consider indicator lag when choosing the best trading indicators. Lagging indicators rely on historical price data to confirm established trends, so they often respond after a price movement has already occurred. Leading indicators aim to anticipate potential price changes by assessing momentum and market conditions, but they can generate more false signals during choppy or sideways markets.
Combining a lagging trend indicator with a leading momentum indicator can provide both broader market context and more timely entry or exit signals.
The Top 5 Trading Indicators Explained
While thousands of custom scripts exist today, most traders build on a small set of time-tested technical analysis tools. Here is a breakdown of the top 5 trading indicators every market participant should understand.
Relative Strength Index (RSI): Timing Momentum and Exhaustion
The Relative Strength Index (RSI) is a momentum oscillator that measures the speed and magnitude of recent price changes on a scale from 0 to 100. The standard default setting evaluates 14 periods.
Among the best trading indicators, the Relative Strength Index (RSI) is commonly used to identify overbought and oversold conditions. Traditionally, an RSI above 70 suggests overbought conditions, while a reading below 30 indicates oversold conditions. However, RSI can remain in these zones for extended periods during strong trends. Traders may also look for RSI divergence, where price forms a higher high while RSI creates a lower high, indicating weakening upward momentum and the possibility of a pullback.
For deeper execution details, read our complete guide on RSI indicator setups.
Moving Average Convergence Divergence (MACD): Measuring Trend Shifts
The Moving Average Convergence Divergence (MACD) is one of the best trading indicators for analyzing trend direction and momentum. It measures the relationship between two exponential moving averages (EMAs). The standard MACD calculation subtracts the 26-period EMA from the 12-period EMA, with the resulting MACD line compared against a 9-period signal line.
Traders look for signal line crossovers to confirm trend momentum. When the MACD line crosses above the signal line, it may suggest upside momentum is building; a cross below can point to growing downside pressure. Crossovers can also produce false signals in sideways markets. The MACD histogram visually displays the distance between the two lines, providing early warnings when momentum begins to decelerate.
Best Indicators for Day Trading and Short-Term Execution
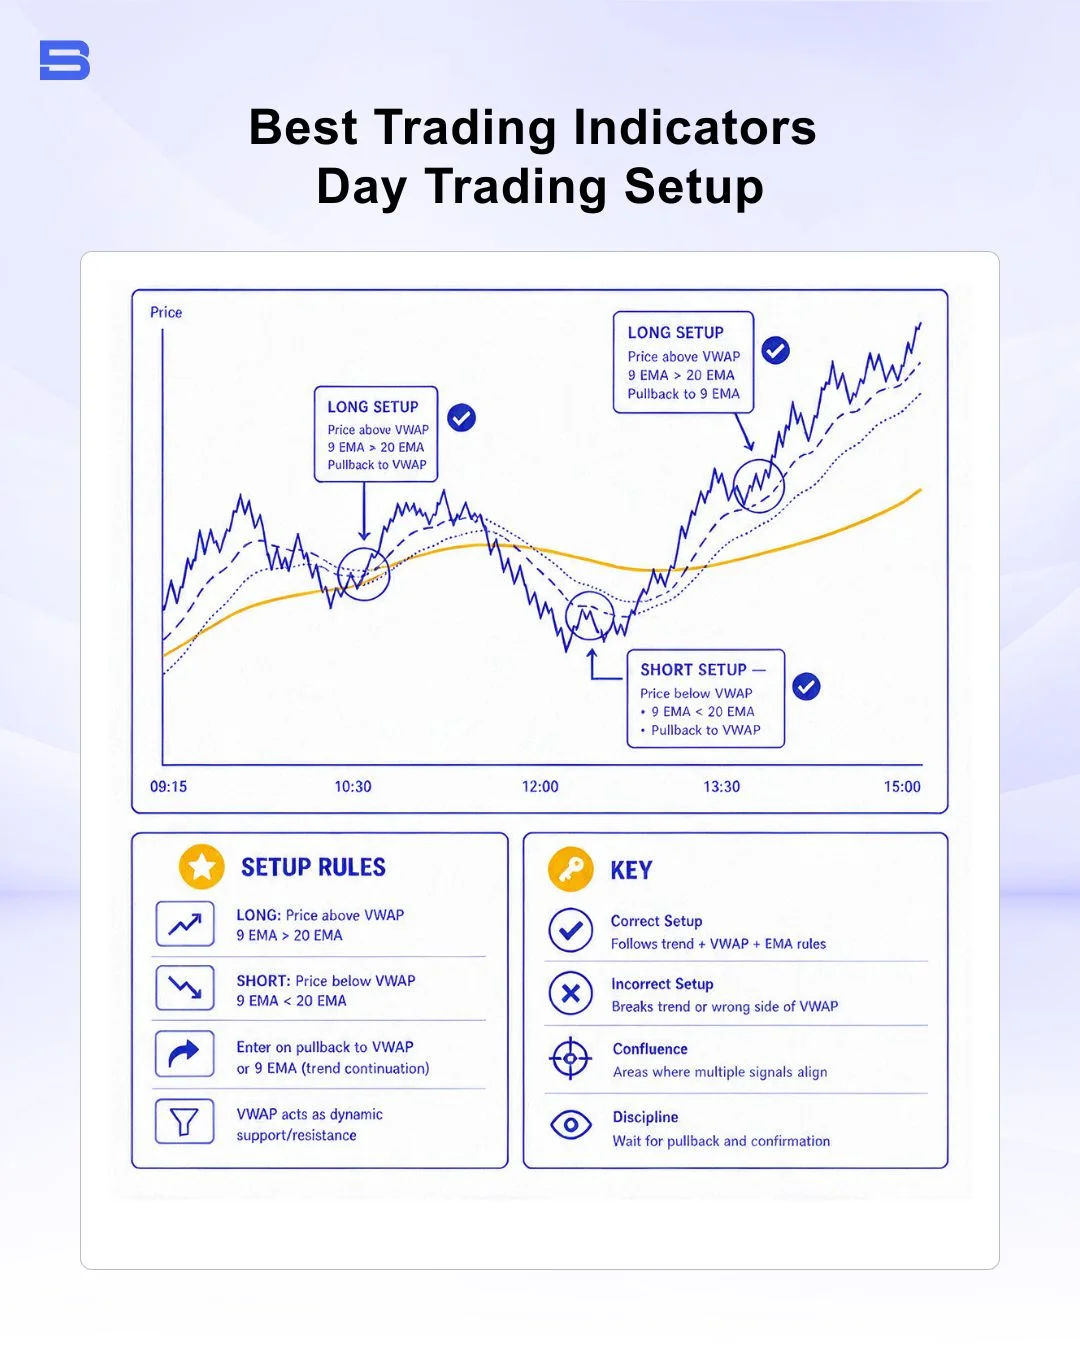
Day traders require responsive tools that reflect real-time institutional participation rather than slow historical averages. Intraday execution relies heavily on Volume Weighted Average Price (VWAP) and short-term Exponential Moving Averages (EMAs).
As one of the best trading indicators for assessing intraday price and volume, VWAP calculates an asset’s volume-weighted average trading price throughout the day. Institutional traders often use VWAP as an execution benchmark. When price remains above VWAP, it may indicate stronger intraday buying pressure, while trading below VWAP can suggest greater selling pressure.
Some day traders pair VWAP with 9- and 20-period EMA crossovers to spot potential pullback entries. Keep in mind that EMAs are still based on past prices, so crossover signals can arrive late or fail in choppy markets. The UK's Financial Conduct Authority (FCA) describes CFDs as complex, high-risk products, largely because leverage can magnify losses just as quickly as gains. For short-term traders, that makes consistent, volatility-based risk controls especially important.
Day Trading vs. Swing Trading Indicator Combinations
Day traders and swing traders often use the same indicator families but tune them for very different time frames. Here's how a typical setup compares:
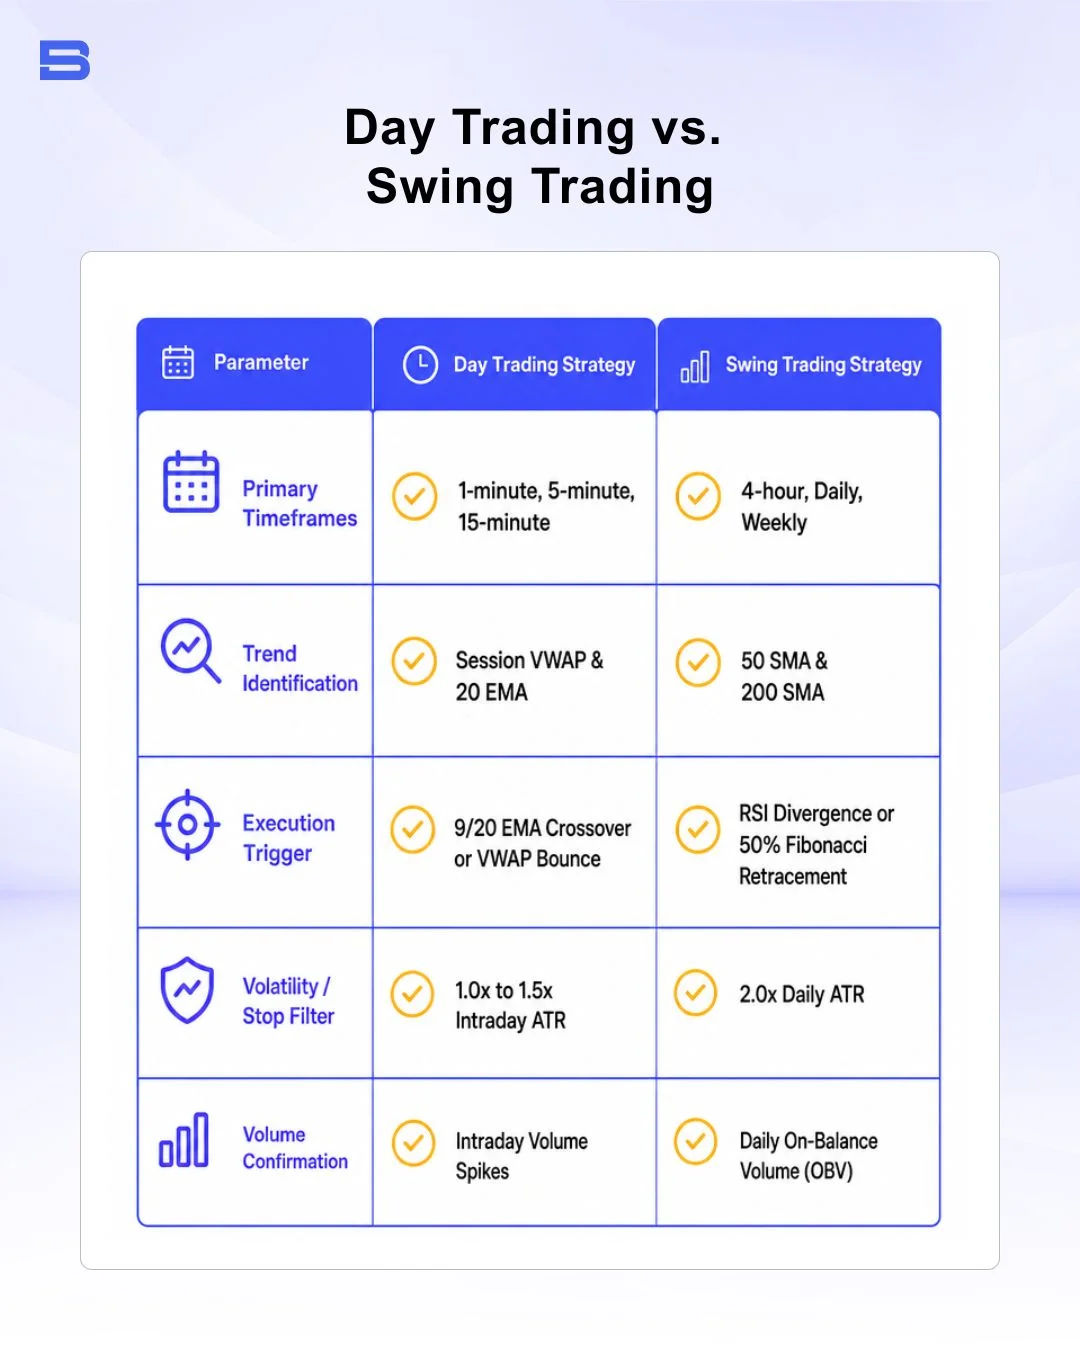
On-Balance Volume (OBV) adds volume on up days and subtracts it on down days to show whether buying or selling pressure is building, while the 50- and 200-period Simple Moving Averages (SMAs) are common long-term trend filters.
How to Combine Indicators Without Chart Clutter
One practical way to keep your chart clean is what we call the 3-Layer Rule. Your trading chart should contain no more than three distinct indicators, each serving a completely different purpose:
- Layer 1 (Trend Filter): Determines whether you are buying or selling (e.g., 50 EMA).
- Layer 2 (Entry Trigger): Identifies specific value areas or momentum turns (e.g., 14 RSI).
- Layer 3 (Risk Filter): Sets objective stop-loss boundaries based on current volatility (e.g., 14 ATR).
Hypothetical example (for illustration only): Before entering, size your position so that the distance to your stop-loss represents only a small, predefined portion of your account, and decide in advance where you'll take profit or exit. Practice any setup like this on a demo account first, since results will vary with market conditions.
A structured evaluation process like this can help reduce emotional decision-making and give you a more disciplined framework for managing your overall market exposure.
How to Choose Indicators That Fit Your Trading Style
Searching for the best trading indicators should not be about finding a single “holy grail” tool. Indicators are not prediction machines; instead, they help traders interpret price structure, identify market conditions, and manage risk systematically. Focus on mastering two or three complementary indicators, establish clear entry and risk-management rules, and maintain disciplined risk control for more consistent long-term execution.
- How to Build an Investment Plan That Actually Works for You?
- What Is the MACD Indicator and How to Use It
- What Is a Wedge Pattern in Trading?
- What Is Ichimoku Cloud Strategy? A Complete Trading System
- Mastering Elliott Wave Theory: Rules and Trading Strategies
- News Trading: Strategies, Execution Risks, and Risk Control
- What Is an Iron Condor Options Strategy?
- Backtesting Explained: What It Is and Why It Really Matters
- Grid Trading: Mechanics, Parameters, and Risk Strategies
- What Is Breakout Trading and How Does It Work?
- Mean Reversion: Technical Strategies and Risk Frameworks
- Momentum Trading: Indicators, Strategies, and Risk Control
- Hammer Candlestick: Structure, Meaning, and Strategy
- Doji Candlestick: Types, Signals, and Trading Strategies
- What Is the Sharpe Ratio and How to Calculate It
- What Is VWAP and How Do Traders Use It?
- Trade the Ascending Triangle: A Step-by-Step Practical Guide
- What Is the Stochastic Oscillator and How to Use It
- How to Trade the Descending Triangle Pattern
- High Frequency Trading: Speed, Algorithms, and Market Impact
- What Is Volume Profile and How to Use It in Trading
- What Is a Morning Star Pattern Candlestick?
- Trade with Parabolic SAR: A Practical Analysis Guide
- Evening Star Pattern: Structure, Rules, and Risk Controls
- Kelly Criterion: Formula, Position Sizing, and Risk
- What Is the NYSE Minimum Trading Price? Rules Explained
Disclaimer: The content on this page is intended for educational and informational purposes only. It does not constitute financial, investment, tax, or legal advice, and should not be interpreted as a recommendation to buy, sell, or hold any financial instrument or asset. Trading and investing involve significant risk, including the possible loss of your entire capital. Products such as forex, CFDs, and cryptocurrencies carry additional risks due to leverage, high volatility, and limited regulatory protection in some jurisdictions. Past performance of any financial instrument does not guarantee future results. Any market views, forecasts, or opinions expressed are those of the author at the time of writing and may not reflect current market conditions. Platform features, fees, and regulatory status are subject to change — always verify information directly with the relevant provider or regulator before making any financial decision. BrokerSpecs may receive compensation from third parties featured on this site. Always conduct your own due diligence and consider seeking advice from a licensed financial professional before investing. Portions of this article were prepared with the assistance of AI tools and reviewed by our editorial team before publication.