


Related Tags
Imagine watching a stock climb steadily for two weeks, printing tall green candles as buyers push prices higher every session. Then, right near a familiar price ceiling, the market gaps down slightly at the open and spends the entire day drifting inside the previous candle’s range. That sudden loss of upward drive is the exact moment a bearish harami appears on your chart.
What Is a Bearish Harami?
A bearish harami is a two-candle reversal pattern that appears after an uptrend, where the body of a smaller bearish candle sits completely inside the body of a large bullish candle. The Japanese word harami translates to “pregnant,” describing how the tall first candle visually shelters the smaller second candle beside it.
When this formation prints near the top of a rally, it may signal that enthusiastic buying pressure has stalled. While a bullish harami appears at the bottom of a downtrend to warn of potential upward turns, its bearish counterpart acts as an early yellow light that an uptrend may be running out of fuel.
How to Identify a Bearish Harami Pattern
Spotting a valid bearish harami pattern requires checking three strict structural conditions on your chart rather than guessing by eye:
- A clear prior uptrend: The market must be moving upward over several sessions, because a reversal signal cannot reverse a trend that does not exist.
- A tall bullish first candle: Day one features a strong green or white candle with a wide real body, sometimes resembling a marubozu candlestick that closes near its high.
- A small bearish second candle inside day one’s body: Day two opens below day one’s close and closes lower, keeping its entire real body strictly inside the open-to-close range of the first candle.
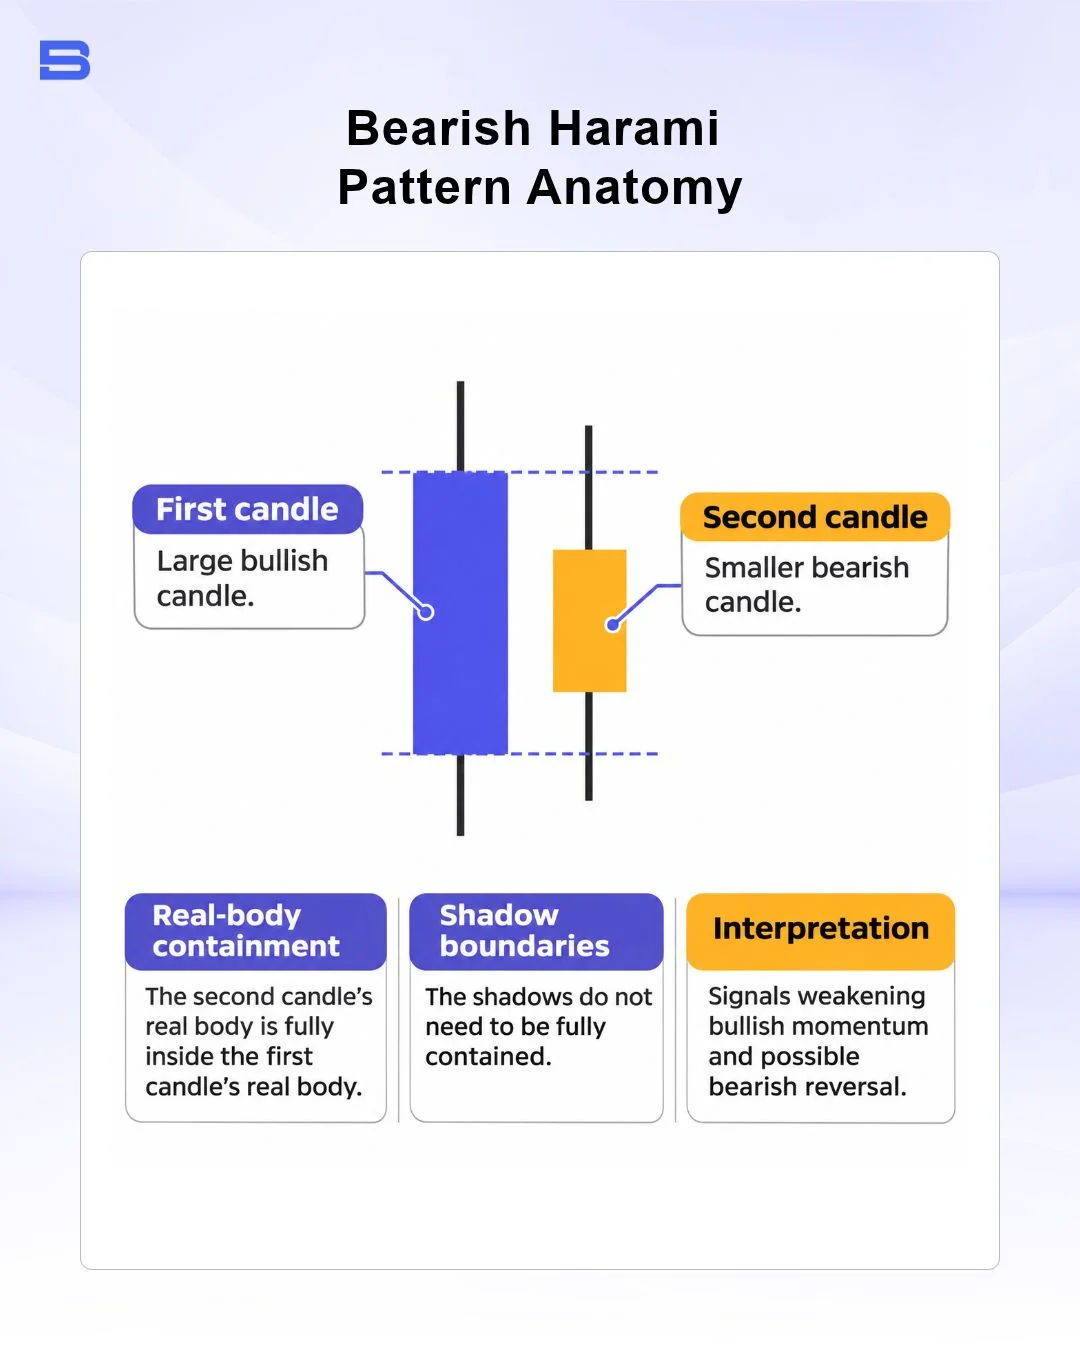
Notice that the containment rule applies strictly to the open-to-close real bodies. Even if the second candle’s thin upper or lower wick pokes slightly outside the first candle’s body, the setup still qualifies as long as the colored bodies stay nested.
What Is a Bearish Harami Cross?
A bearish harami cross is a specialized variation where the second candle is a doji instead of a small red body. Because a doji opens and closes at virtually the same price, it reflects a complete deadlock between buyers and sellers right after a strong upward surge. Technical analysts generally view this doji variation as a sharper warning of buyer exhaustion than a standard harami.
Bearish Harami Candlestick vs. Other Bearish Reversal Patterns
Not every topping formation carries the same immediate selling force. The harami candlestick shows buyers stepping back, whereas single-candle rejections like a gravestone doji candlestick show sellers actively pushing price back down within a single session.
Bearish Harami vs. Bearish Engulfing and Inside Bars
Beginners often confuse two-candle patterns because their silhouettes look similar at a glance. Comparing their exact containment rules helps keep your chart reading accurate. A bearish engulfing pattern works the other way around: the second red candle’s real body completely covers the first green candle’s real body, which shows sellers taking control rather than buyers simply pausing.
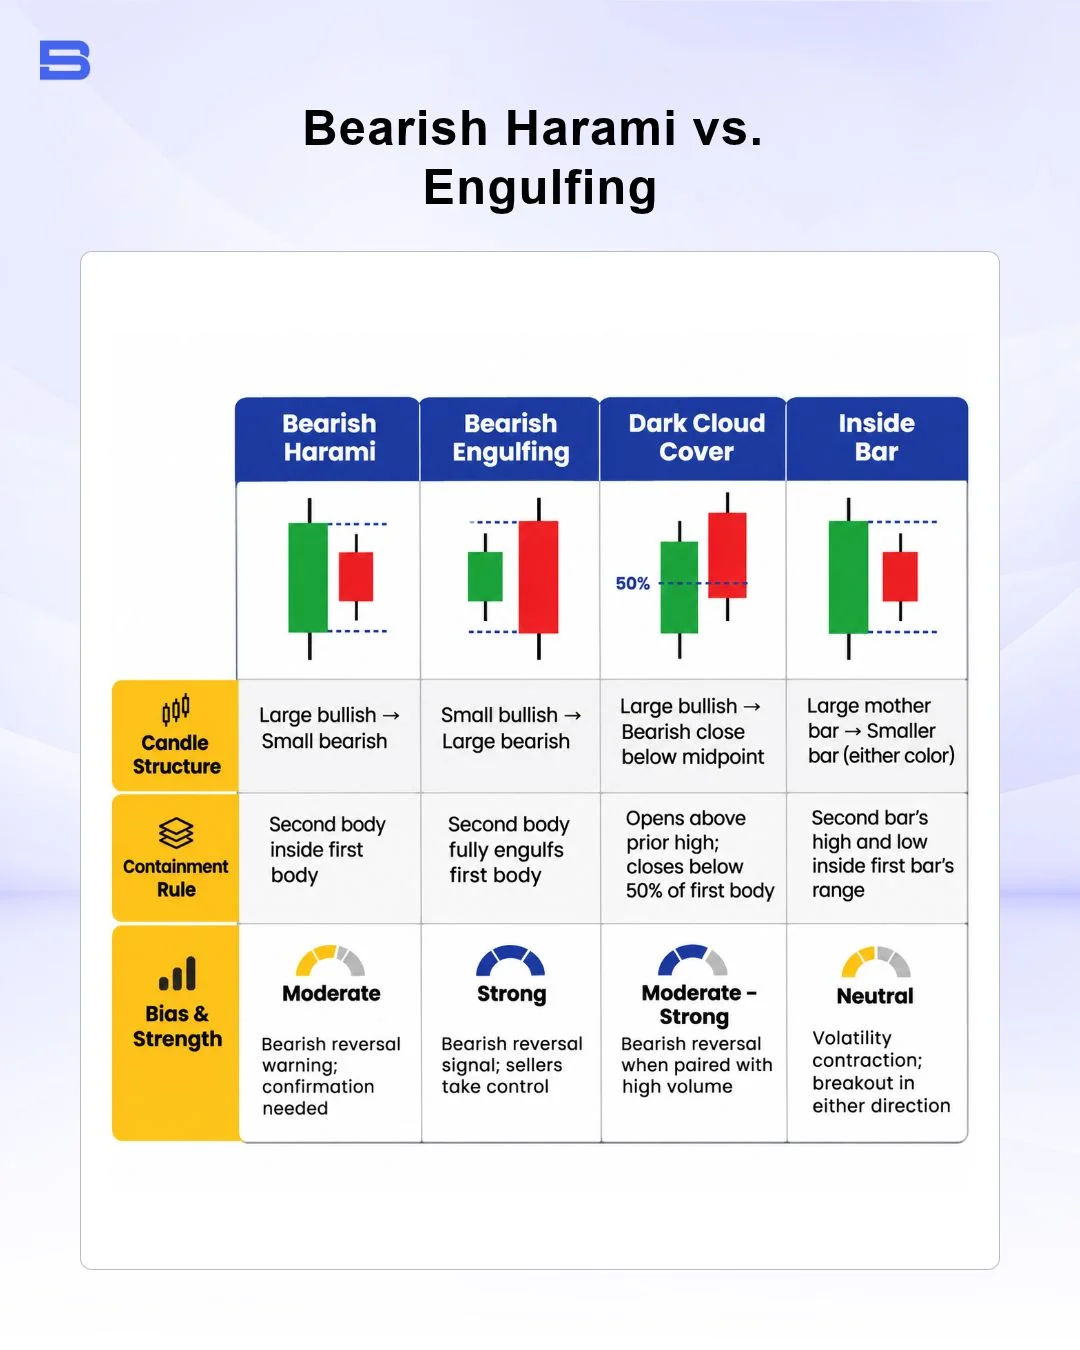
The crucial distinction lies between the harami and an inside bar. An inside bar requires the entire high-to-low wick range to stay inside the mother candle (the larger first candle) and can break out in either direction, whereas a harami focuses on real-body containment at the top of an uptrend.
How to Trade a Bearish Harami Safely
Treating this pattern as an automatic sell trigger often leads to avoidable losses during strong rallies. Instead, wait for two layers of confirmation: price forming near established support and resistance, and a third “confirmation candle” closing below the second candle’s low.
Consider a practical example on a $10,000 trading account where you cap risk at 1%, or $100 per trade:
- Setup and confirmation: A stock rallies into $51.00 resistance and prints the harami, followed by a third red candle that closes at $49.90.
- Entry and stop-loss: You enter a short position at $50.00 and place your stop-loss at $51.00, just above the first candle’s high, creating a $1.00 per-share risk.
- Position size and target: Dividing your $100 risk budget by $1.00 gives you 100 shares, with a profit target at $48.00 for a 1:2 risk-to-reward ratio ($200 potential gain versus $100 risk). These figures exclude trading costs. Commissions, spreads, and borrowing fees on short positions reduce the net result of any trade.
Keep in mind that stop-loss orders do not eliminate downside risk. If overnight news causes the stock to gap up from $50.50 to $52.50 at the open, slippage can fill your stop well above $51.00 and turn a planned $100 loss into a $250 loss. Global securities regulators, including the International Organization of Securities Commissions (IOSCO), warn retail investors that leveraged products can lead to rapid losses, especially when markets gap or reverse unexpectedly.
Common Mistakes Traders Make With a Bearish Harami
Even experienced chart readers misplay this pattern when they overlook market context. Watching out for three common traps can protect your capital from low-probability setups:
- Trading the pattern inside a sideways range: When price is bouncing flatly between tight boundaries, small candles inside larger candles happen constantly and carry little predictive value.
- Entering before the confirmation candle closes: Jumping into a short trade on candle two leaves you exposed if buyers immediately step back in and push price to new highs on candle three.
- Setting stop-losses too tight inside the mother candle: Placing a stop just above the small second candle often gets triggered by normal intraday noise before the actual downward move begins.
Historical chart patterns reflect past crowd psychology rather than guaranteed future outcomes, which makes strict position sizing essential on every trade.
Conclusion
A bearish harami is best used as an early warning light rather than a standalone sell button. By waiting for a third confirmation candle near resistance and sizing your stop-loss above the first candle’s high, you can evaluate potential reversals with clear, predefined risk.
- How to Build an Investment Plan That Actually Works for You?
- What Is the MACD Indicator and How to Use It
- What Is a Wedge Pattern in Trading?
- What Is Ichimoku Cloud Strategy? A Complete Trading System
- Mastering Elliott Wave Theory: Rules and Trading Strategies
- News Trading: Strategies, Execution Risks, and Risk Control
- What Is an Iron Condor Options Strategy?
- Backtesting Explained: What It Is and Why It Really Matters
- Grid Trading: Mechanics, Parameters, and Risk Strategies
- What Is Breakout Trading and How Does It Work?
- Mean Reversion: Technical Strategies and Risk Frameworks
- Momentum Trading: Indicators, Strategies, and Risk Control
- Hammer Candlestick: Structure, Meaning, and Strategy
- Doji Candlestick: Types, Signals, and Trading Strategies
- What Is the Sharpe Ratio and How to Calculate It
- What Is VWAP and How Do Traders Use It?
- Trade the Ascending Triangle: A Step-by-Step Practical Guide
- What Is the Stochastic Oscillator and How to Use It
- How to Trade the Descending Triangle Pattern
- High Frequency Trading: Speed, Algorithms, and Market Impact
- What Is Volume Profile and How to Use It in Trading
- What Is a Morning Star Pattern Candlestick?
- Trade with Parabolic SAR: A Practical Analysis Guide
- Evening Star Pattern: Structure, Rules, and Risk Controls
- Kelly Criterion: Formula, Position Sizing, and Risk
- What Is the NYSE Minimum Trading Price? Rules Explained
Disclaimer: The content on this page is intended for educational and informational purposes only. It does not constitute financial, investment, tax, or legal advice, and should not be interpreted as a recommendation to buy, sell, or hold any financial instrument or asset. Trading and investing involve significant risk, including the possible loss of your entire capital. Products such as forex, CFDs, and cryptocurrencies carry additional risks due to leverage, high volatility, and limited regulatory protection in some jurisdictions. Past performance of any financial instrument does not guarantee future results. Any market views, forecasts, or opinions expressed are those of the author at the time of writing and may not reflect current market conditions. Platform features, fees, and regulatory status are subject to change — always verify information directly with the relevant provider or regulator before making any financial decision. BrokerSpecs may receive compensation from third parties featured on this site. Always conduct your own due diligence and consider seeking advice from a licensed financial professional before investing. Portions of this article were prepared with the assistance of AI tools and reviewed by our editorial team before publication.