


Related Tags
Entering a trade right as a trend gathers strength can feel like catching a perfect wave, but jump in too late, and that same momentum collapses into a costly reversal. Financial markets move in cycles of expansion and contraction, making it difficult to determine whether a price breakout reflects genuine underlying buying pressure or just a brief market flicker.
To navigate these shifting conditions without getting caught on the wrong side of the chart, traders rely on technical tools designed to measure short-term market momentum against broader historical trends. One of the most popular indicators for evaluating these momentum shifts is the Awesome Oscillator (AO).
What Is the Awesome Oscillator and How Does It Work?
The AO is a technical analysis indicator used to measure market momentum by comparing short-term market movements against long-term price trends. Developed by legendary technical analyst Bill Williams, the indicator evaluates whether current market forces are driving prices faster or slower than their historical average.
Unlike conventional momentum tools that rely solely on closing prices, the AO calculates momentum using the midpoint of each price bar (the median price). By shifting the focus to midpoints, the indicator smooths out extreme closing spikes and provides a clearer representation of true market sentiment.
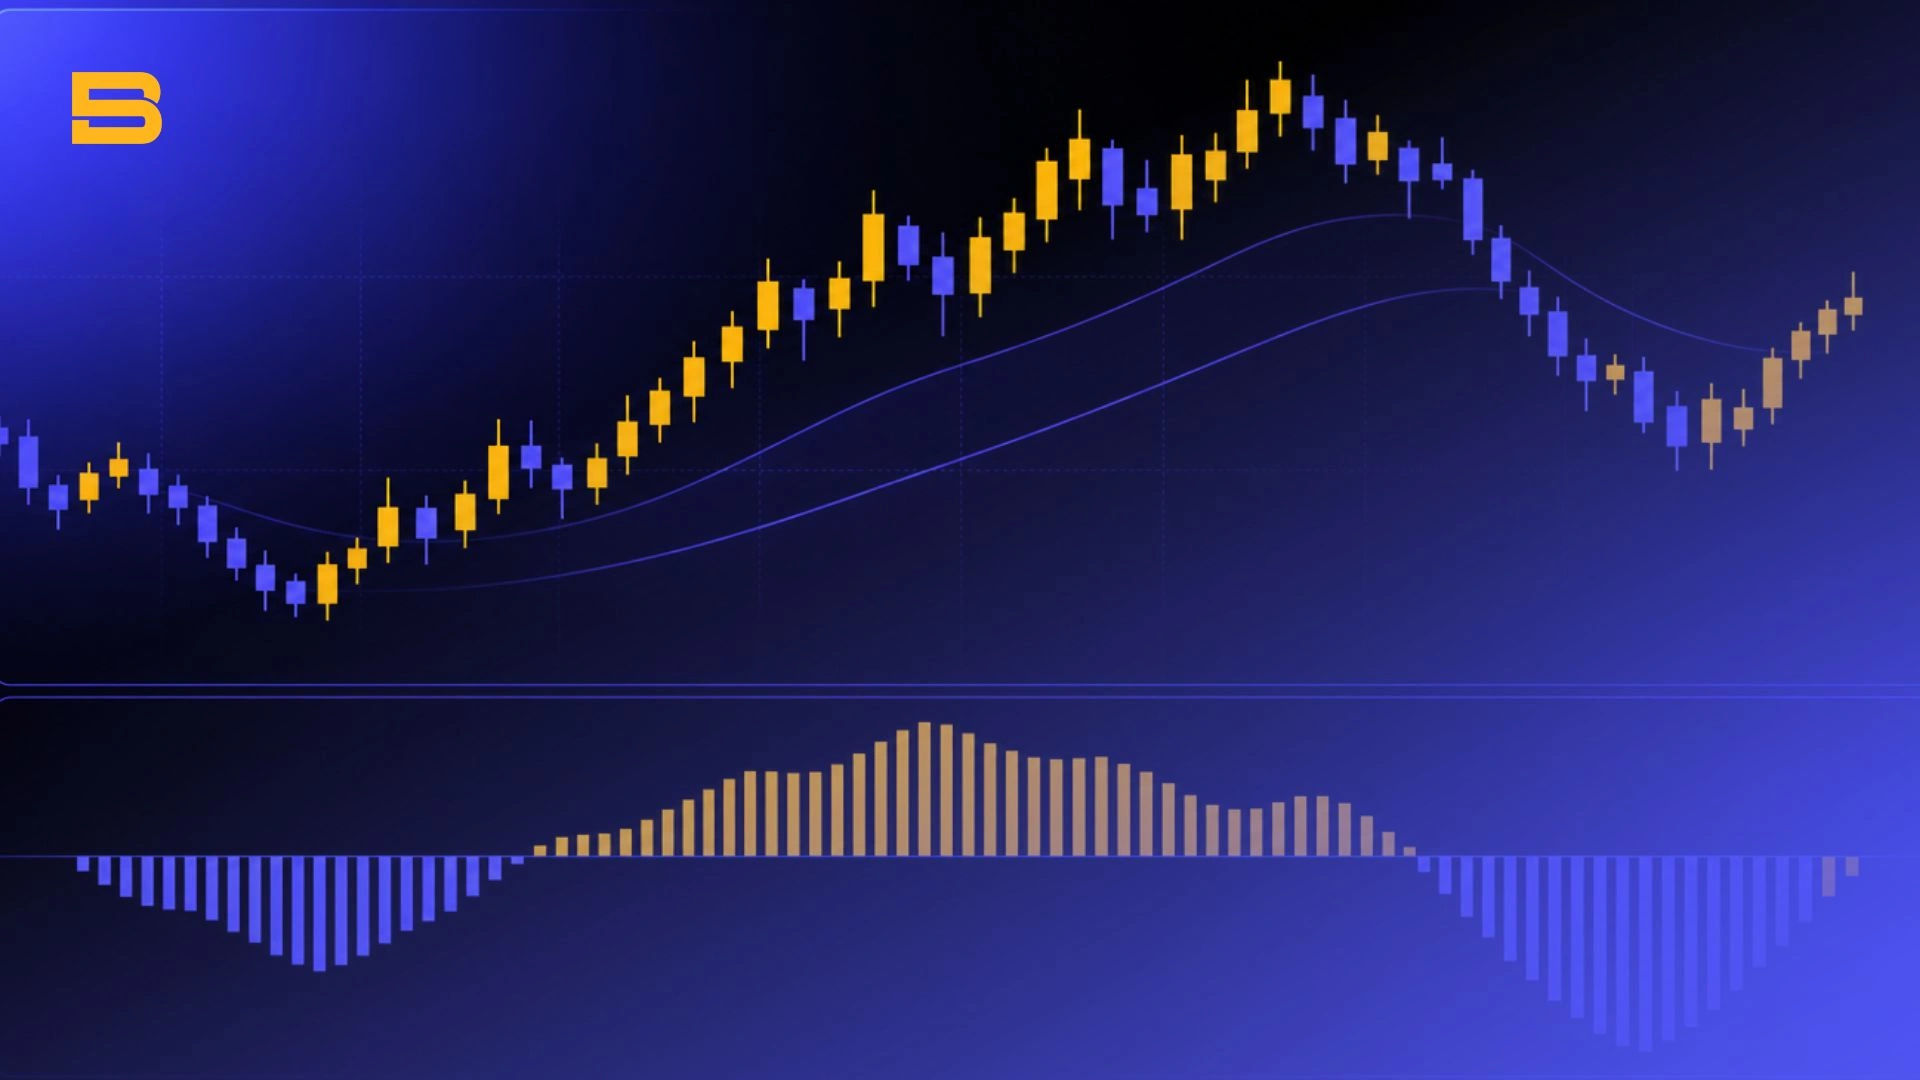
The indicator is displayed as a histogram oscillating above and below a central Zero Line:
- Histogram Bars Above the Zero Line: Indicate that short-term momentum is stronger than long-term momentum, signaling potential bullish market conditions.
- Histogram Bars Below the Zero Line: Indicate that short-term momentum is weaker than long-term momentum, signaling potential bearish market conditions.
To help traders quickly read momentum direction, the histogram bars are color-coded. A green bar indicates that the current bar's value is higher than the previous bar's value (increasing momentum). A red bar indicates that the current bar's value is lower than the previous bar's value (decreasing momentum).
Understanding momentum direction gives you a grounded perspective on market strength, but confirming entry timing often works best when combining momentum readings with trend structure, such as identifying oversold conditions using the Relative Strength Index (RSI) indicator.
How Is the Awesome Oscillator Calculated?
The mathematical structure of the AO relies on comparing a 5-period Simple Moving Average (SMA) with a 34-period SMA. However, instead of applying these moving averages to closing prices—as is standard practice for tools like simple moving averages—the calculation uses the median price of each period.
The Median Price Calculation
The median price represents the midpoint between the highest and lowest price reached during a specific candle or bar:
- Median Price = (High + Low) / 2
Worked Example: If a stock reaches a high of $105 and a low of $95 during a trading session, its median price calculation is (105 + 95) / 2 = 100. The indicator uses this $100 value as the input for its moving averages rather than the final closing price.
The Core Formula
Once the median price for each bar is established, the AO formula subtracts the 34-period SMA of median prices from the 5-period SMA of median prices:
AO = SMA_5 (Median Price) - SMA_34 (Median Price)
- 5-Period SMA: Tracks short-term momentum across recent price action.
- 34-Period SMA: Tracks longer-term momentum across a broader historical baseline.
Because the indicator compares two moving averages, its baseline shifts around zero. When short-term price action accelerates faster than the 34-period baseline, the AO value rises above zero. When short-term prices fall below the longer-term average, the AO value drops below zero. For deeper technical standards on momentum derivations, technical analysts often consult guidance published by the CFA Institute.
How Do You Trade with the Awesome Oscillator? (Key Signals)
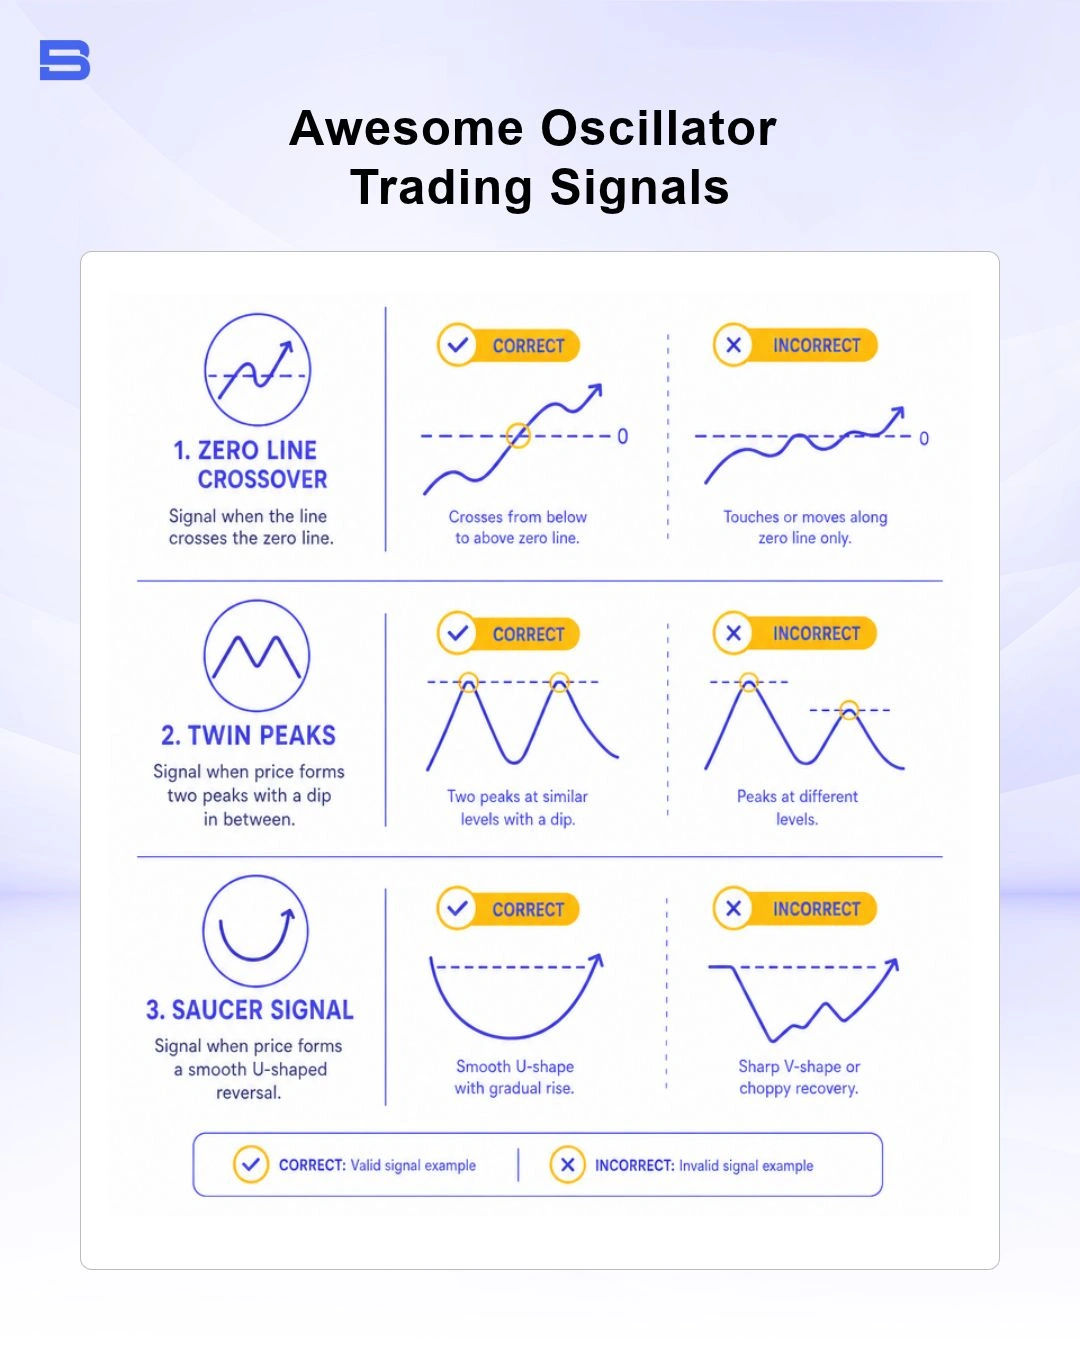
Traders use the AO to identify shifts in buying and selling pressure across three main trading setups: Zero Line Crossovers, Twin Peaks, and Saucer Patterns.
Zero Line Crossover Signals
The simplest strategy involves monitoring when the histogram crosses the central Zero Line.
- Bullish Crossover: Occurs when the histogram crosses from negative territory (below zero) to positive territory (above zero). This indicates that short-term momentum has overtaken long-term momentum, signaling a potential buying entry.
- Bearish Crossover: Occurs when the histogram drops from positive territory to negative territory. This indicates that selling pressure is dominating short-term market action, signaling a potential short entry or exit from long positions.
The Twin Peaks Setup
The twin peaks strategy looks for divergence between two consecutive peaks or troughs on the same side of the Zero Line.
- Bullish Twin Peaks: Form below the Zero Line. The indicator creates a first low peak, followed by a second low peak that is higher (less negative) than the first. The signal is confirmed when the histogram produces a green bar following the second peak. Crucially, the histogram must remain below the Zero Line throughout the entire formation.
- Bearish Twin Peaks: Form above the Zero Line. The indicator creates a high peak, followed by a second peak that is lower than the first. The signal is confirmed when the histogram produces a red bar after the second peak, indicating that buying momentum is exhausting.
The Saucer Pattern
The saucer pattern is a fast-response strategy that seeks momentum acceleration within a single direction across three consecutive histogram bars.
- Bullish Saucer: Operates entirely above the Zero Line. It requires at least three bars: a green bar (or any bar), followed by a red bar that is lower than the first bar, followed by a second green bar that is higher than the second bar. The entry signal triggers on the opening of the candle following the third bar.
- Bearish Saucer: Operates entirely below the Zero Line. It requires a bar in negative territory, followed by a green bar that rises closer to zero, followed by a red bar that drops lower than the second bar. This setup signals a resumption of strong selling momentum.
What Is the Difference Between the MACD and the Awesome Oscillator?
Because both tools feature a histogram visual centered around a zero line, traders frequently confuse the AO with the Moving Average Convergence Divergence indicator (MACD). While both evaluate momentum, their underlying mechanics and calculation inputs differ significantly.
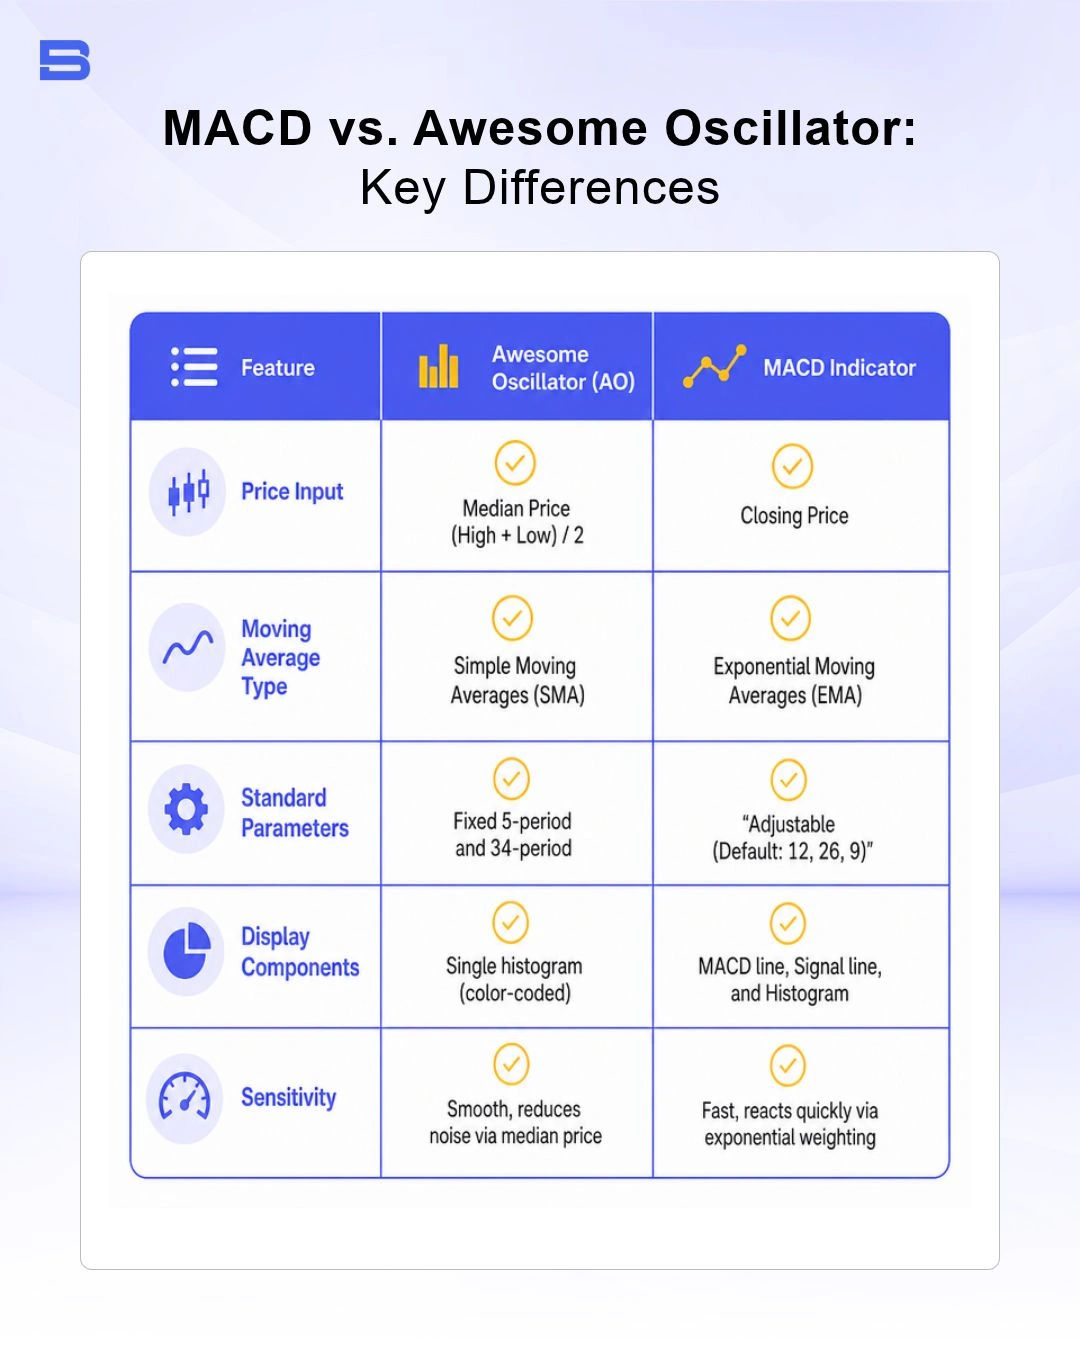
The primary difference lies in responsiveness and structure. The MACD utilizes Exponential Moving Averages (EMAs), which place greater weight on recent closing prices. This makes the MACD faster to react to sharp price moves, though it can generate more false signals during choppy trading.
In contrast, the Awesome Oscillator uses Simple Moving Averages of median prices, creating a smoother histogram that filters out brief price noise. For a deeper breakdown of EMA-based momentum tools, explore our comprehensive guide on the MACD indicator.
Combining the Awesome Oscillator with Other Technical Indicators
Using the AO as a standalone entry tool in ranging or sideways markets can lead to frequent whipsaws. Combining the AO with complementary technical tools helps filter false signals and improves entry confirmation.
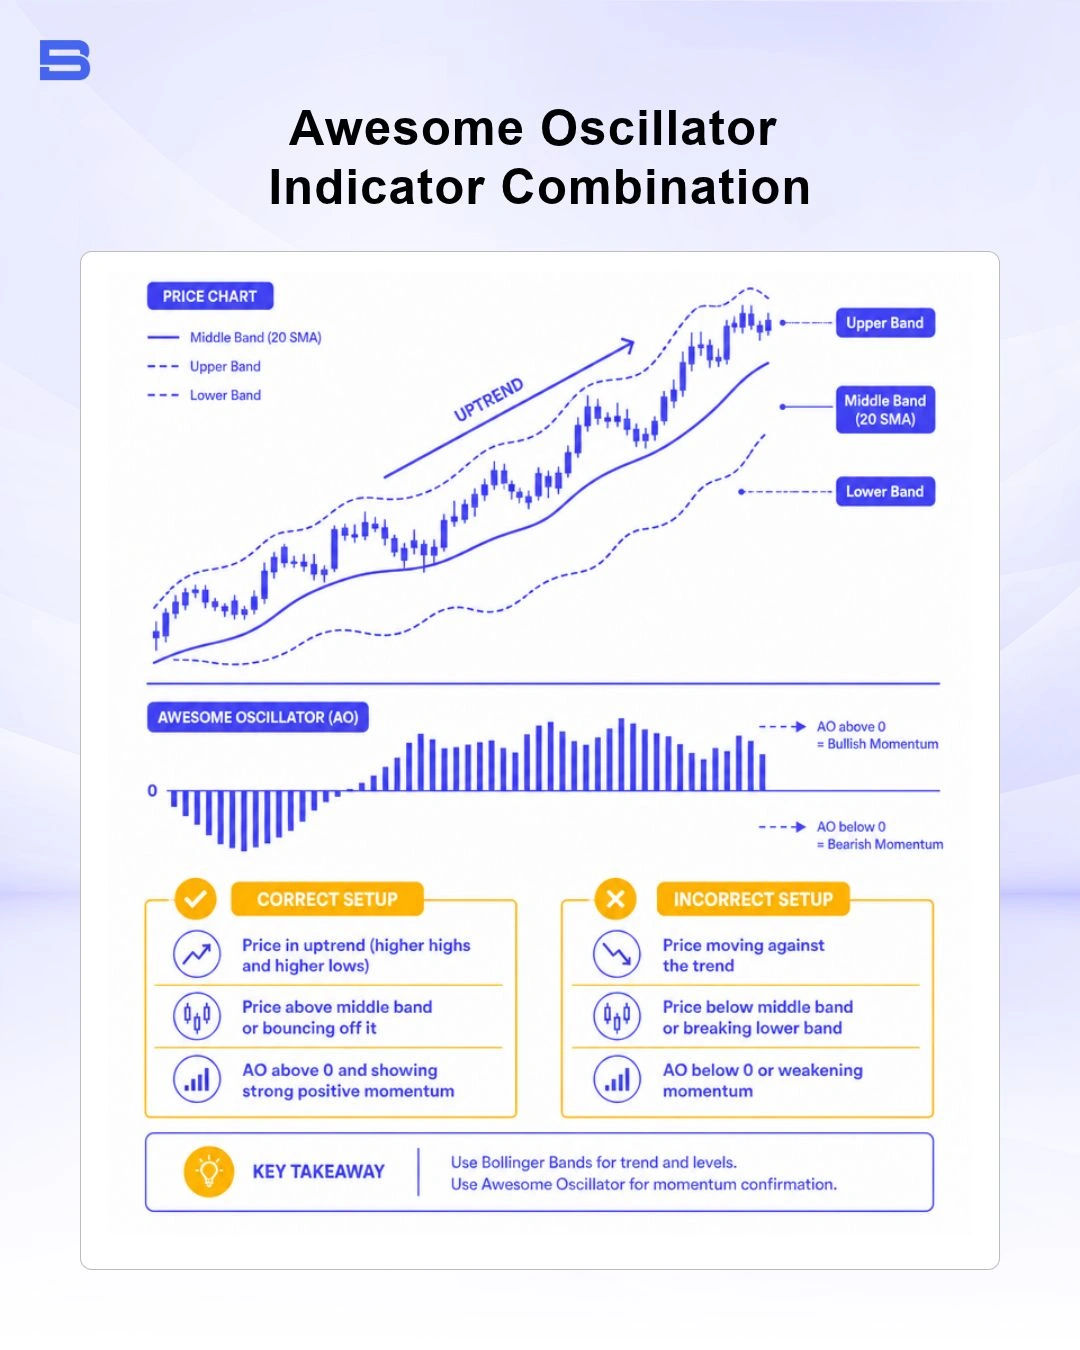
- Trend Filtering: Pair the AO with a structural trend tool like moving average setups or Heikin Ashi candles to ensure you only take AO crossover signals aligned with the broader market direction.
- Breakout Confirmation: When price reaches key structural support or resistance, tools like Bollinger Bands help identify volatility expansions. Taking a Bullish Saucer signal while price breaks above the upper Bollinger Band offers stronger statistical confirmation than an isolated histogram signal.
- Key Level Confluence: Cross-referencing AO Twin Peaks divergence with major Fibonacci retracement levels (such as 61.8%) or daily Volume-Weighted Average Price (VWAP) benchmarks provides structural confluence, reducing the likelihood of jumping into exhausted moves.
Common Pitfalls and Risk Management When Using the Awesome Oscillator
While the Awesome Oscillator provides clear momentum visualizations, relying on it blindly carries substantial trading risks. Understanding the indicator's structural limitations is essential for preserving capital.
- Indicator Lag: Because the AO relies on a 34-period SMA baseline, it is fundamentally a lagging indicator. During sharp, news-driven market spikes, price can move significantly before the histogram reflects a Zero Line crossover or saucer signal.
- Ranging Market Whipsaws: In low-volatility or sideways markets, the AO frequently weaves back and forth across the Zero Line. Executing trades on every crossover in a consolidated market leads to rapid capital depletion through spread costs and repeated stop-out losses.
- False Divergence: Twin Peaks divergence signals can persist for extended periods during strong, uninterrupted trends. Selling into a powerful uptrend simply because the AO displays a lower peak often results in severe losses.
To mitigate these risks, always implement strict position sizing limits and hard stop-loss orders on every trade. Never risk more than 1% to 2% of your total account balance on a single setup. Regulatory warnings published by authorities such as the US Securities and Exchange Commission (SEC) consistently emphasize that technical indicators do not eliminate market risk or protect against sudden volatility spikes.
The Bottom Line
The Awesome Oscillator offers a clean, mathematically sound way to evaluate market momentum by comparing short-term price behavior against long-term baselines. By using median price averages rather than closing prices, Bill Williams created a tool that smooths price noise and highlights genuine momentum acceleration through setups like Zero Line crossovers, Twin Peaks, and Saucers.
- How to Build an Investment Plan That Actually Works for You?
- What Is the MACD Indicator and How to Use It
- What Is a Wedge Pattern in Trading?
- What Is Ichimoku Cloud Strategy? A Complete Trading System
- Mastering Elliott Wave Theory: Rules and Trading Strategies
- News Trading: Strategies, Execution Risks, and Risk Control
- What Is an Iron Condor Options Strategy?
- Backtesting Explained: What It Is and Why It Really Matters
- Grid Trading: Mechanics, Parameters, and Risk Strategies
- What Is Breakout Trading and How Does It Work?
- Mean Reversion: Technical Strategies and Risk Frameworks
- Momentum Trading: Indicators, Strategies, and Risk Control
- Hammer Candlestick: Structure, Meaning, and Strategy
- Doji Candlestick: Types, Signals, and Trading Strategies
- What Is the Sharpe Ratio and How to Calculate It
- What Is VWAP and How Do Traders Use It?
- Trade the Ascending Triangle: A Step-by-Step Practical Guide
- What Is the Stochastic Oscillator and How to Use It
- How to Trade the Descending Triangle Pattern
- High Frequency Trading: Speed, Algorithms, and Market Impact
- What Is Volume Profile and How to Use It in Trading
- What Is a Morning Star Pattern Candlestick?
- Trade with Parabolic SAR: A Practical Analysis Guide
- Evening Star Pattern: Structure, Rules, and Risk Controls
- Kelly Criterion: Formula, Position Sizing, and Risk
- What Is the NYSE Minimum Trading Price? Rules Explained
Disclaimer: The content on this page is intended for educational and informational purposes only. It does not constitute financial, investment, tax, or legal advice, and should not be interpreted as a recommendation to buy, sell, or hold any financial instrument or asset. Trading and investing involve significant risk, including the possible loss of your entire capital. Products such as forex, CFDs, and cryptocurrencies carry additional risks due to leverage, high volatility, and limited regulatory protection in some jurisdictions. Past performance of any financial instrument does not guarantee future results. Any market views, forecasts, or opinions expressed are those of the author at the time of writing and may not reflect current market conditions. Platform features, fees, and regulatory status are subject to change — always verify information directly with the relevant provider or regulator before making any financial decision. BrokerSpecs may receive compensation from third parties featured on this site. Always conduct your own due diligence and consider seeking advice from a licensed financial professional before investing. Portions of this article were prepared with the assistance of AI tools and reviewed by our editorial team before publication.