



Related Tags
You spot a sharp trend pullback, open a position expecting a clean rebound, and watch the market immediately sweep through your stop. Catching market turns feels impossible when you enter on impulse, but price action often repeats structured geometric rhythms before reversing.
What Is the ABCD Pattern? A Harmonic Setup Explained
The ABCD pattern is a foundational four-point chart structure where the initial price thrust (AB) matches the concluding drive (CD) in price distance and duration. It serves as the visual building block for almost all classical harmonic patterns.
Instead of guessing where market momentum runs out, you use this four-point cycle—labeled A, B, C, and D—to define structured turning points. The setup begins with an impulsive price leg from point A to point B, followed by a corrective counter-move from point B to point C. Once point C holds, price launches into its final leg, CD, which mirrors the original AB trajectory.
Practicing ABCD pattern trading allows you to look past intraday market noise and measure when a corrective swing has reached statistical completion. When the final leg reaches symmetry, the market completes the formation and creates a defined reaction area.
Understanding Fibonacci Symmetry in AB=CD
Harmonic structures rely on mathematical symmetry rather than random chart swings. To validate an authentic AB=CD setup, leg BC must respect specific Fibonacci retracement ratios of the initial AB swing.
In classical harmonic geometry, point C typically retraces to 0.618 or 0.786 of leg AB. If price blows past the 0.786 level or breaks point A, the structural validity collapses, and the pattern becomes invalid. Once point C is established, the final CD leg projects outward as a reciprocal extension of BC, specifically targeting a 1.272 or 1.618 Fibonacci expansion.
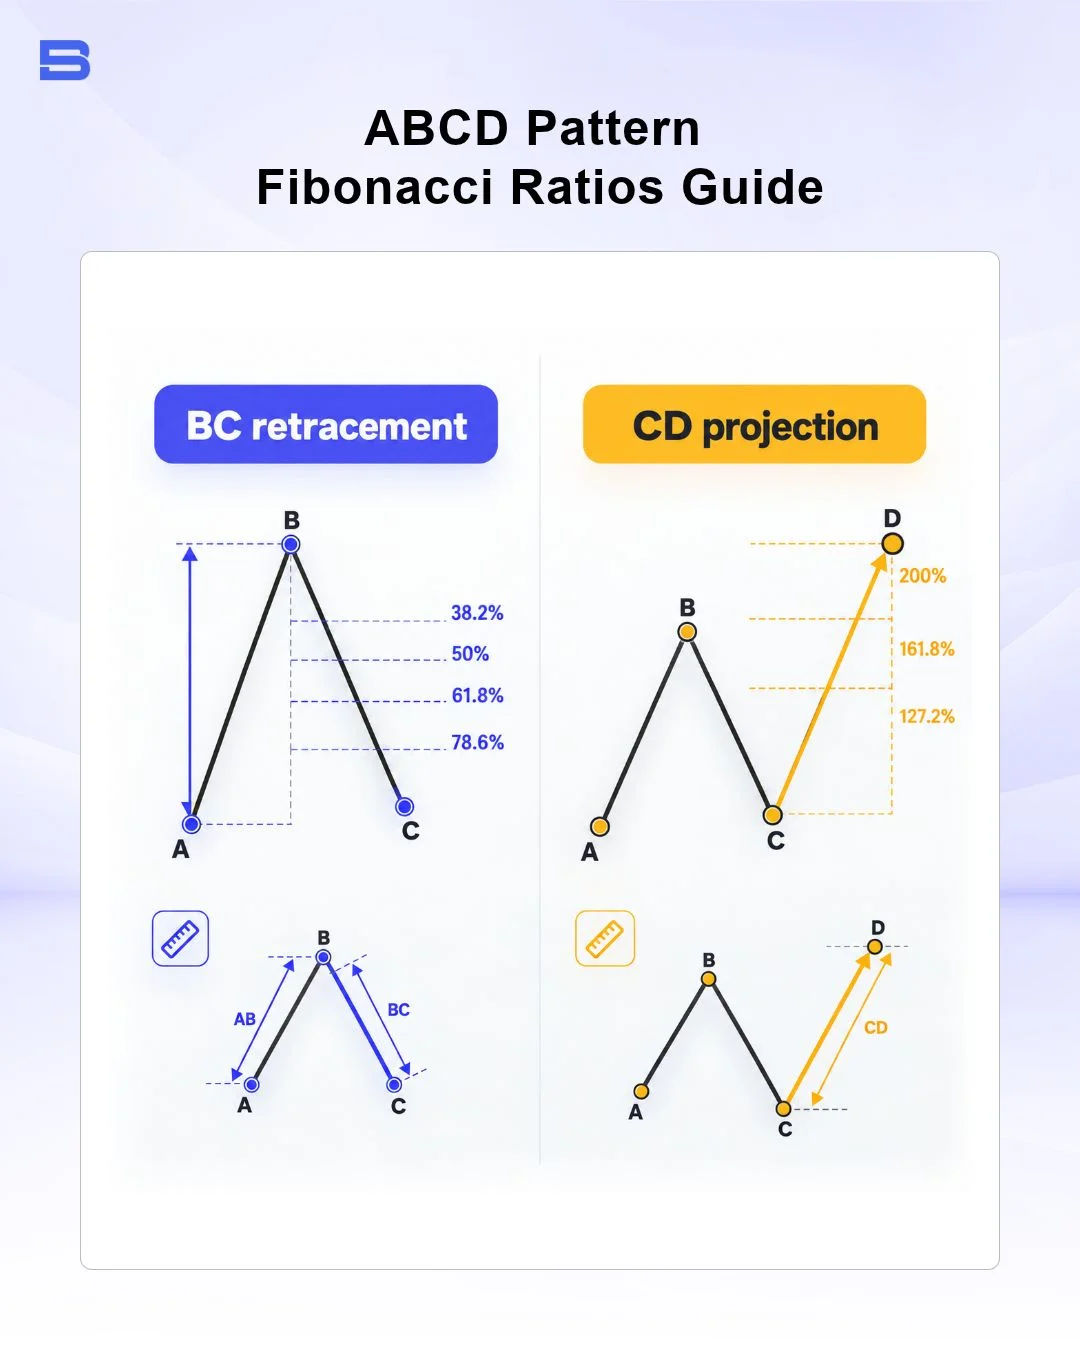
True symmetry demands equal price distance and comparable elapsed time. If leg AB took 12 four-hour candles to form 100 pips of movement, leg CD should ideally cover a similar 100 pips across approximately 10 to 14 candles, a rhythm also observed in setups like the three drives pattern.
Bullish vs. Bearish ABCD Formations
The ABCD formation adapts to both rising and falling market environments, signaling when a prevailing drive is becoming exhausted.
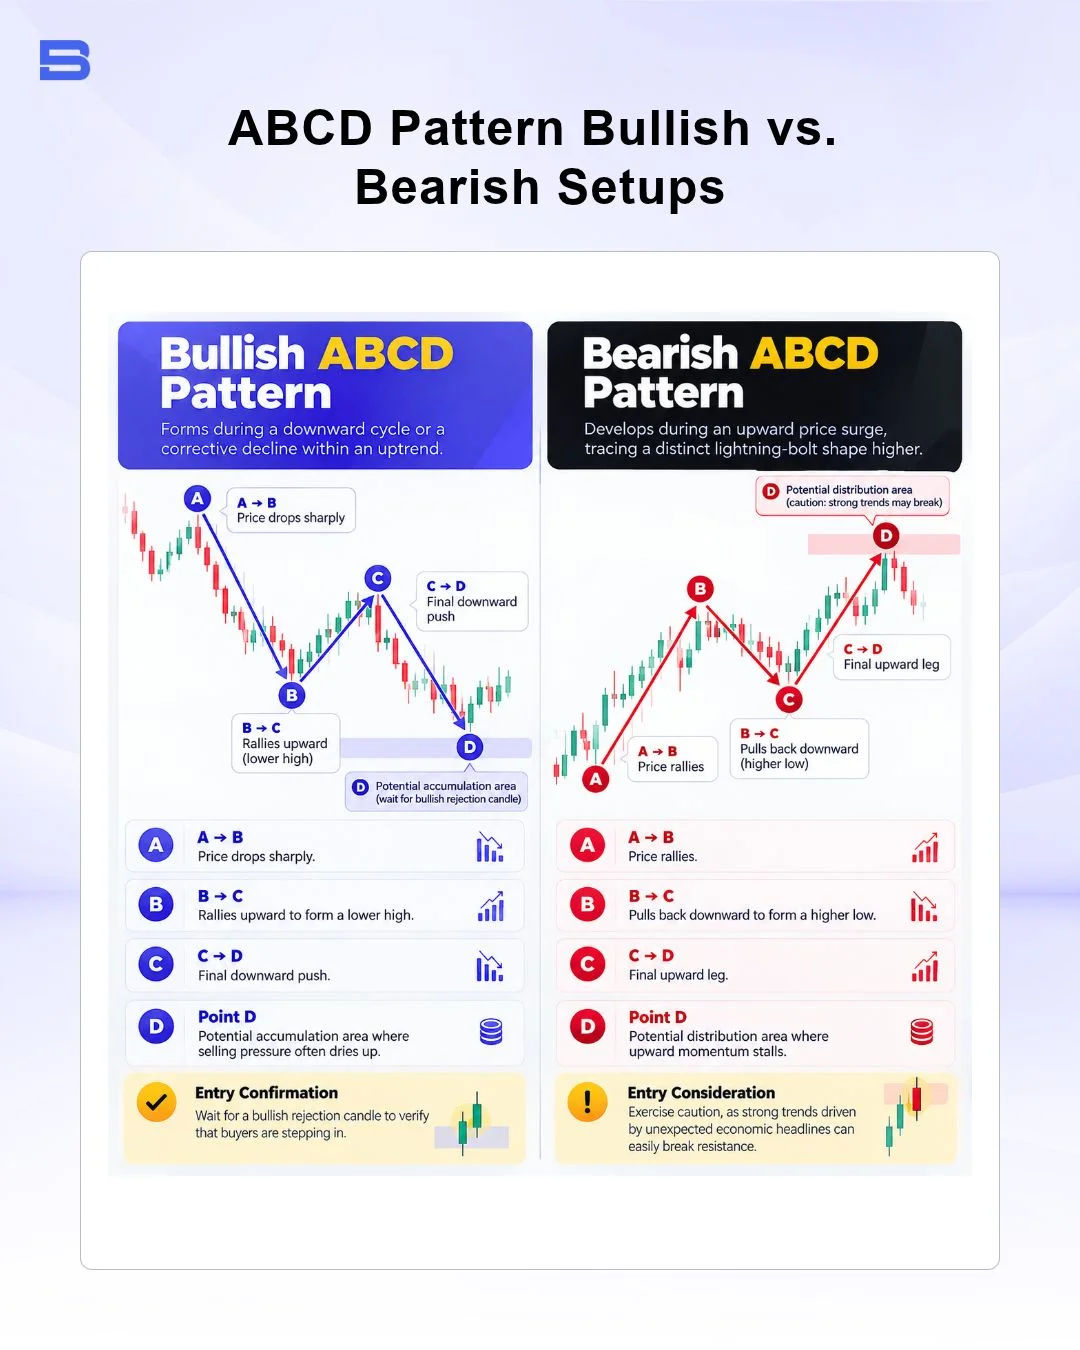
Bullish ABCD Pattern Setup: Buying at Point D
A bullish ABCD pattern forms during an overall downward cycle or a corrective decline within an uptrend. Price drops sharply from A to B, rallies upward to form a lower high at C, and then makes a final downward push to point D.
Point D represents an accumulation area where institutional selling pressure often dries up. You do not place a blind buy order as price plunges toward D; you wait for a bullish rejection candle to verify that buyers are stepping in.
Bearish ABCD Pattern Setup: Shorting at Point D
A bearish ABCD pattern develops during an upward price surge, tracing a distinct lightning-bolt shape higher. Price rallies from A to B, pulls back downward to form a higher low at C, and drives upward to complete leg CD.
Point D marks a potential distribution area where upward momentum stalls and short-sellers prepare for an impending downward reversal. Entering here requires caution because runaway trends driven by unexpected economic headlines can easily slice through resistance without hesitating.
Identifying the Potential Reversal Zone at Point D
Point D is not a pinpoint price tick; it forms a confluence band known as the potential reversal zone (PRZ). This zone emerges where the 100% price projection of AB aligns closely with the Fibonacci extension of BC.
Traders often lose money when they place pending limit orders directly inside the PRZ, assuming the market must reverse purely because a ratio was touched. In live market conditions, institutional liquidity runs can push price significantly past mathematical targets before finding equilibrium.
Advanced traders wait for confluence, checking if the PRZ aligns with an established support level or an overextended oscillator reading, similar to confirming a reversal in a Gartley pattern. Entering only after an engulfing bar or pin bar closes inside the PRZ significantly filters out false breakouts.
A Worked Scenario: Executing an ABCD Trade with Exact Math
Let us walk through a practical scenario on EUR/USD to see how the geometry translates into execution parameters.
Assume EUR/USD climbs from point A at 1.0800 to point B at 1.0900, establishing an initial AB swing of 100 pips. Price then pulls back to point C at 1.0838, which precisely matches the 61.8% Fibonacci retracement of the AB leg. Because point C held above point A, the bullish structure remains intact and projects a matching 100-pip rally for leg CD.
Calculating from point C (1.0838) plus 100 pips establishes your potential completion target at D around 1.0938, which also converges with the 1.618 extension of BC (1.0838 + 62 pips * 1.618 ≈ 1.0938).
By defining your risk beforehand, you risk 25 pips to capture 50 to 100 pips, establishing a favorable 1:2 to 1:4 risk-to-reward ratio. You can manage your position safely by deploying a calculated stop-loss rather than leaving the outcome to emotion.
Common Pitfalls and Risk Management Realities
Harmonic geometry provides a clear visual map, but financial markets are under no obligation to respect textbook Fibonacci ratios. Fundamental catalysts, interest rate decisions, and geopolitical shocks will override technical patterns in seconds.
A frequent error among beginner traders is ignoring time asymmetry. If leg AB took two days to form, but leg CD takes three weeks of choppy consolidation to reach the same price distance, the underlying momentum has changed, and the pattern's predictive value deteriorates. Furthermore, executing during periods of thin liquidity can lead to severe slippage, causing your fill price to deviate substantially from your planned entry.
Professional bodies like the CFA Institute emphasize that systematic risk management and capital preservation must always take precedence over pattern identification. Similarly, the Securities Commission Malaysia (SC) frequently warns retail investors that leveraged trading products amplify both gains and losses equally, meaning an unhedged position can trigger rapid capital loss if a pattern fails. Never risk more than 1% to 2% of your total account balance on a single setup.
- How to Build an Investment Plan That Actually Works for You?
- What Is the MACD Indicator and How to Use It
- What Is a Wedge Pattern in Trading?
- What Is Ichimoku Cloud Strategy? A Complete Trading System
- Mastering Elliott Wave Theory: Rules and Trading Strategies
- News Trading: Strategies, Execution Risks, and Risk Control
- What Is an Iron Condor Options Strategy?
- Backtesting Explained: What It Is and Why It Really Matters
- Grid Trading: Mechanics, Parameters, and Risk Strategies
- What Is Breakout Trading and How Does It Work?
- Mean Reversion: Technical Strategies and Risk Frameworks
- Momentum Trading: Indicators, Strategies, and Risk Control
- Hammer Candlestick: Structure, Meaning, and Strategy
- Doji Candlestick: Types, Signals, and Trading Strategies
- What Is the Sharpe Ratio and How to Calculate It
- What Is VWAP and How Do Traders Use It?
- Trade the Ascending Triangle: A Step-by-Step Practical Guide
- What Is the Stochastic Oscillator and How to Use It
- How to Trade the Descending Triangle Pattern
- High Frequency Trading: Speed, Algorithms, and Market Impact
- What Is Volume Profile and How to Use It in Trading
- What Is a Morning Star Pattern Candlestick?
- Trade with Parabolic SAR: A Practical Analysis Guide
- Evening Star Pattern: Structure, Rules, and Risk Controls
- Kelly Criterion: Formula, Position Sizing, and Risk
- What Is the NYSE Minimum Trading Price? Rules Explained
Disclaimer: The content on this page is intended for educational and informational purposes only. It does not constitute financial, investment, tax, or legal advice, and should not be interpreted as a recommendation to buy, sell, or hold any financial instrument or asset. Trading and investing involve significant risk, including the possible loss of your entire capital. Products such as forex, CFDs, and cryptocurrencies carry additional risks due to leverage, high volatility, and limited regulatory protection in some jurisdictions. Past performance of any financial instrument does not guarantee future results. Any market views, forecasts, or opinions expressed are those of the author at the time of writing and may not reflect current market conditions. Platform features, fees, and regulatory status are subject to change — always verify information directly with the relevant provider or regulator before making any financial decision. BrokerSpecs may receive compensation from third parties featured on this site. Always conduct your own due diligence and consider seeking advice from a licensed financial professional before investing. Portions of this article were prepared with the assistance of AI tools and reviewed by our editorial team before publication.