


Related Tags
Imagine spotting a textbook breakout on a daily stock chart. The price surges past a multi-month resistance line on heavy volume, prompting you to enter a buy order at the market open. Within hours, the upward momentum vanishes. Price reverses sharply back into the previous range, triggering your stop-loss and leaving your account with a frustrating loss.
This setup is known as a liquidity trap. While retail traders buy into the perceived breakout, institutional entities use that surging retail demand to sell off large positions without driving the market price down against themselves.
Understanding who controls market supply and demand—and recognizing when large institutions are quietly accumulating or distributing shares—is the foundation of the Wyckoff trading method.
What Is the Wyckoff Trading Method?
The Wyckoff method is a technical analysis framework developed by Richard Wyckoff in the early 20th century that evaluates supply and demand dynamics through structural price patterns and volume behavior.
Wyckoff’s primary observation was that financial markets are driven by large institutional market participants—such as investment funds, central banks, and market makers—whose capital volume is too massive to hide. Rather than entering or exiting positions all at once, these entities build and liquidate positions over extended consolidation phases.
Instead of relying on lagging mathematical indicators, the Wyckoff method analyzes the interaction between raw price action and volume to track institutional order flow. Regulatory authorities like the US Securities and Exchange Commission (SEC) enforce market integrity rules to restrict illegal price manipulation, but legal institutional position-building still leaves behind distinct, readable traces on price charts.
The Concept of the Composite Man
To simplify market analysis, Richard Wyckoff introduced the theoretical concept of the Composite Man. Wyckoff advised traders to view all market fluctuations as if they were orchestrated by a single, highly strategic entity operating behind the scenes.
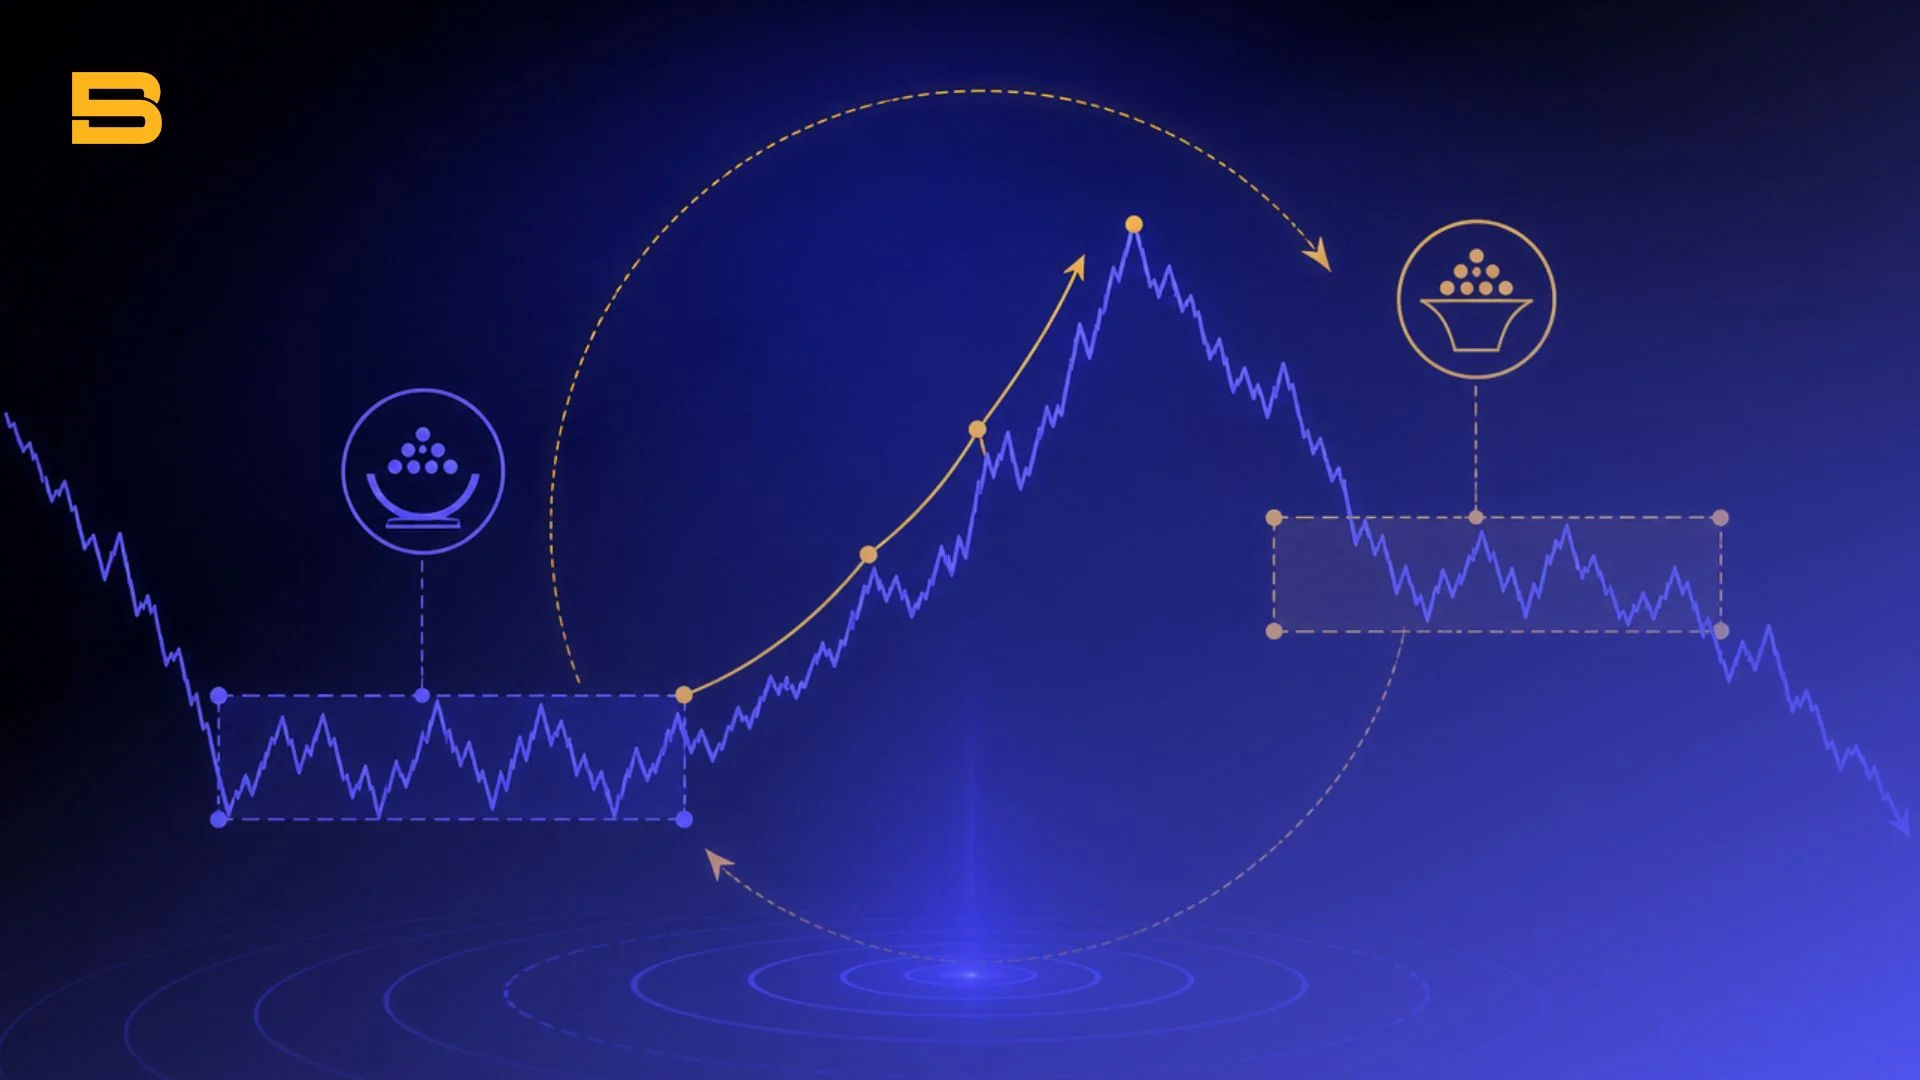
The Composite Man quietly accumulates assets at lower prices during periods of public disinterest, marks up the price to generate public enthusiasm, distributes positions to unsuspecting retail buyers at peak prices, and then initiates a markdown phase.
By analyzing price and volume relationships, you can align your trade executions alongside institutional capital rather than trading against it.
The Three Fundamental Laws of the Wyckoff Method
The Wyckoff method operates on three foundational principles that govern price movement across all liquid financial markets.
1. The Law of Supply and Demand
This law determines the primary direction of market price:
- Demand > Supply: Prices rise because buyers are willing to pay higher ask prices to secure assets.
- Supply > Demand: Prices fall because sellers compete to exit positions, accepting lower bid prices.
- Supply = Demand: Prices consolidate within a horizontal trading range due to balanced order flow.
Traders evaluate this law by analyzing volume bars alongside price candles. Expanding volume on bullish candles indicates active institutional demand, whereas rising volume on bearish candles confirms dominant selling supply.
2. The Law of Cause and Effect
This law establishes a relationship between the duration of a consolidation range and the scale of the subsequent price trend:
- The Cause: The horizontal trading range formed during an accumulation phase or distribution phase.
- The Effect: The vertical price trend (markup or markdown) that follows the range breakout.
A prolonged consolidation period builds a larger "cause," which historically yields a more sustained directional "effect." Wyckoff traders historically used Point-and-Figure charts to calculate price targets based on the horizontal width of a consolidation base.
3. The Law of Effort vs. Result
This law identifies divergence between trading volume (effort) and price movement (result), signaling potential trend exhaustion or reversal:
- Harmonious Effort & Result: High volume paired with a wide-range price candle confirms that volume is actively moving price in the direction of the trend.
- Divergent Effort & Result: Heavy trading volume paired with a narrow price candle or an inability to make a new high/low indicates institutional absorption, often warning of an impending market reversal.
Understanding Wyckoff Accumulation and Distribution Schematics
The Wyckoff method price cycle moves through four distinct sequential stages: Accumulation, Markup, Distribution, and Markdown.
The Wyckoff Accumulation Phase Breakdown
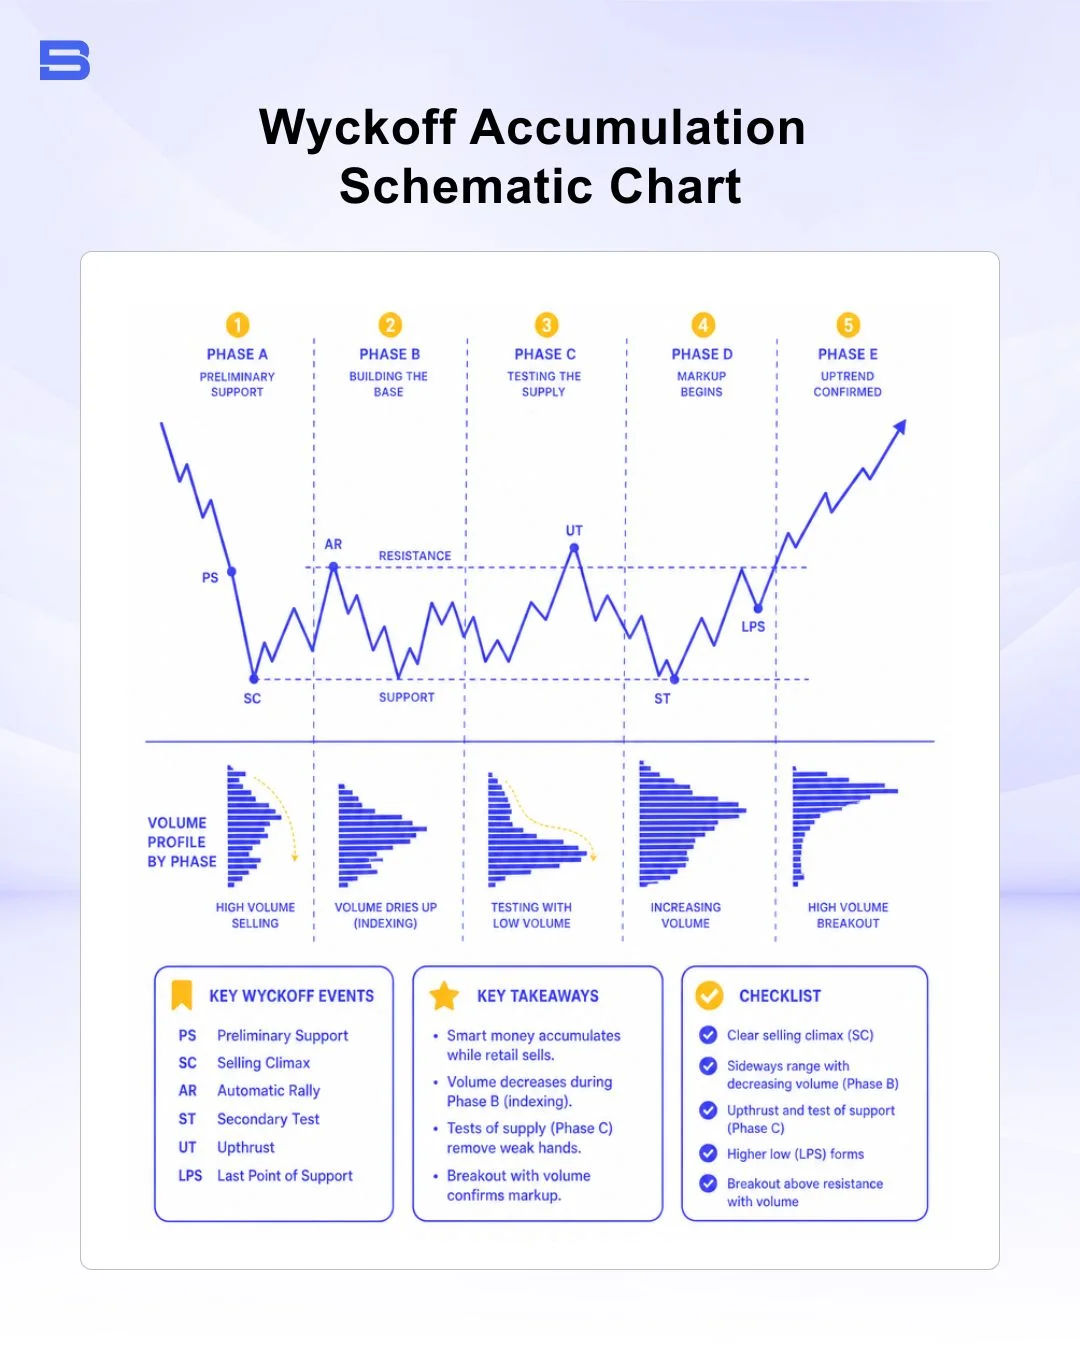
The accumulation schematic represents institutional buying within a defined trading range before a markup phase begins. This schematic is structured into five distinct phases:
- Phase A (Stopping the Previous Downtrend): High volume confirms heavy selling pressure reaching a Preliminary Support (PS) level, followed by a Selling Climax (SC) where institutional absorption creates an Automatic Rally (AR). The range boundary is established after a Secondary Test (ST).
- Phase B (Building Cause): Institutions quietly accumulate shares while testing remaining market supply. Price bounces between support and resistance with decreasing volume.
- Phase C (The Test / Structural Spring): Price undergoes a decisive test of supply, often sweeping below Phase A support to trap short sellers and grab liquidity.
- Phase D (Trend Confirmation): Price recovers back inside the trading range with expanding volume, forming a Last Point of Support (LPS) and a Sign of Strength (SOS) past the upper resistance.
- Phase E (Markup Execution): Supply is fully absorbed, and the asset exits the range into a sustained uptrend.
Key Structural Events: Springs and Upthrusts
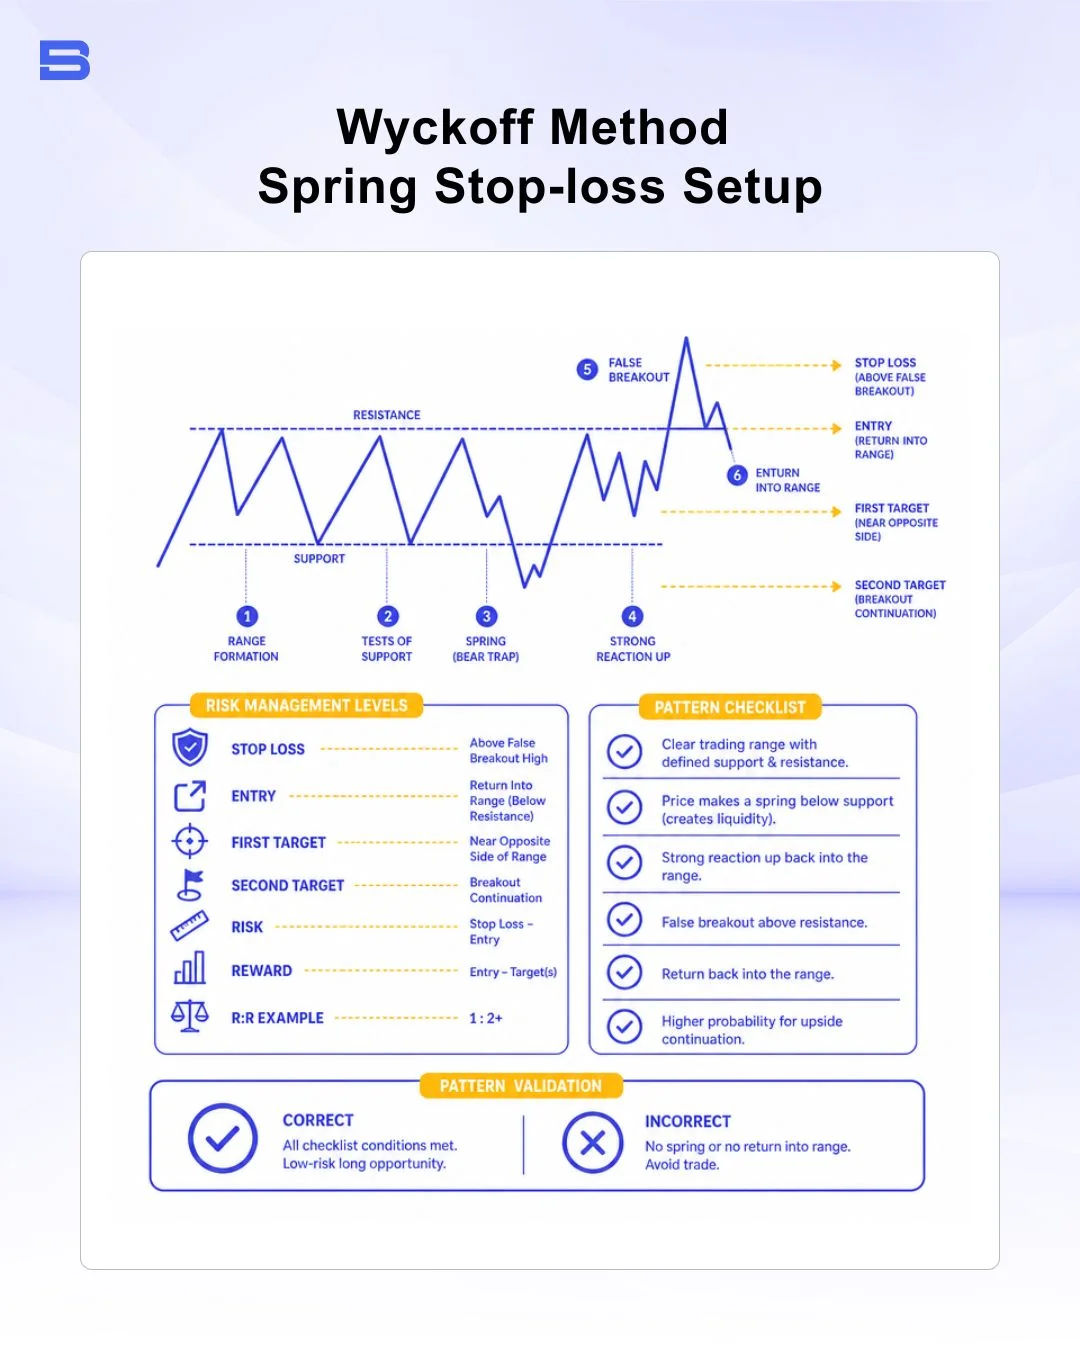
A Spring occurs in Phase C of an accumulation schematic when price temporarily breaks below the established support level before quickly closing back inside the range. Conversely, an Upthrust (UT) occurs during a distribution phase when price briefly spikes above resistance before failing and dropping back into the trading range.
Springs and Upthrusts are liquidity traps designed to trigger retail stop-loss orders and entice breakout traders in the wrong direction.
When trading a Wyckoff Spring:
- Wait for price to break below support and immediately recover back into the trading range on high volume.
- Enter a long position on the subsequent retest (the Last Point of Support).
- Place a strict stop-loss order slightly below the lowest low of the Spring pivot structure.
Integrating Wyckoff Analysis with Modern Volume Indicators
While Richard Wyckoff analyzed raw tape charts, modern traders enhance structural Wyckoff analysis by integrating volume-based technical indicators.
Combining structural Wyckoff phases with tools like the VWAP indicator (Volume Weighted Average Price) helps traders verify whether price is trading at a premium or discount relative to institutional volume centers.
- VWAP Alignment: During Phase D of accumulation, price breaking and holding above the session VWAP on expanding volume provides objective confirmation of institutional buying control.
- Volume Profile Integration: Utilizing Volume Profile helps identify Point of Control (POC) nodes—price levels with the highest traded volume within the Wyckoff range—which serve as critical support levels during retests.
Comparing Wyckoff Method to Dow Theory and Classical Technicals
The Wyckoff method shares historical roots with early market theories while providing distinct analytical focus areas:
- Wyckoff vs. Dow Theory: Dow Theory focuses primarily on primary market trends, sector confirmations, and higher-high/higher-low market structures. Wyckoff adds detailed volume-spread analysis to explain why trends begin and end within consolidation ranges.
- Wyckoff vs. Geometric Theories: Unlike Gann theory or complex geometric harmonic pattern structures that rely on fixed mathematical angles or ratio projections, Wyckoff analysis remains strictly flexible, focusing on real-time shifts in order flow and volume absorption.
Final Thoughts
The Wyckoff method equips traders with a structured framework for analyzing institutional order flow through supply, demand, and volume relationships. By identifying key structural events like Springs and Upthrusts within consolidation ranges, you can avoid common breakout traps and align your trading entries alongside market operators.
However, structural patterns can fail during unexpected macroeconomic events. Managing your risk through disciplined position sizing and placing protective stop-loss orders behind key structural pivot levels remains essential for long-term capital preservation.
- How to Build an Investment Plan That Actually Works for You?
- What Is the MACD Indicator and How to Use It
- What Is a Wedge Pattern in Trading?
- What Is Ichimoku Cloud Strategy? A Complete Trading System
- Mastering Elliott Wave Theory: Rules and Trading Strategies
- News Trading: Strategies, Execution Risks, and Risk Control
- What Is an Iron Condor Options Strategy?
- Backtesting Explained: What It Is and Why It Really Matters
- Grid Trading: Mechanics, Parameters, and Risk Strategies
- What Is Breakout Trading and How Does It Work?
- Mean Reversion: Technical Strategies and Risk Frameworks
- Momentum Trading: Indicators, Strategies, and Risk Control
- Hammer Candlestick: Structure, Meaning, and Strategy
- Doji Candlestick: Types, Signals, and Trading Strategies
- What Is the Sharpe Ratio and How to Calculate It
- What Is VWAP and How Do Traders Use It?
- Trade the Ascending Triangle: A Step-by-Step Practical Guide
- What Is the Stochastic Oscillator and How to Use It
- How to Trade the Descending Triangle Pattern
- High Frequency Trading: Speed, Algorithms, and Market Impact
- What Is Volume Profile and How to Use It in Trading
- What Is a Morning Star Pattern Candlestick?
- Trade with Parabolic SAR: A Practical Analysis Guide
- Evening Star Pattern: Structure, Rules, and Risk Controls
- Kelly Criterion: Formula, Position Sizing, and Risk
- What Is the NYSE Minimum Trading Price? Rules Explained
Disclaimer: The content on this page is intended for educational and informational purposes only. It does not constitute financial, investment, tax, or legal advice, and should not be interpreted as a recommendation to buy, sell, or hold any financial instrument or asset. Trading and investing involve significant risk, including the possible loss of your entire capital. Products such as forex, CFDs, and cryptocurrencies carry additional risks due to leverage, high volatility, and limited regulatory protection in some jurisdictions. Past performance of any financial instrument does not guarantee future results. Any market views, forecasts, or opinions expressed are those of the author at the time of writing and may not reflect current market conditions. Platform features, fees, and regulatory status are subject to change — always verify information directly with the relevant provider or regulator before making any financial decision. BrokerSpecs may receive compensation from third parties featured on this site. Always conduct your own due diligence and consider seeking advice from a licensed financial professional before investing. Portions of this article were prepared with the assistance of AI tools and reviewed by our editorial team before publication.