



Related Tags
Imagine opening your trading platform during a period of intense market volatility. Prices are fluctuating wildly, and you suddenly wonder how much capital your portfolio could lose if market conditions deteriorate further. Relying on a vague intuition that "things will be fine" leaves your capital exposed to sudden market shocks.
To manage portfolio risk effectively, financial institutions and independent traders rely on a standardized quantitative metric: Value at Risk (VaR).
What Is Value at Risk (VaR)?
Value at Risk (VaR) is a statistical risk management metric used to estimate the maximum potential financial loss of an investment portfolio over a defined timeframe, given a specific confidence level. Instead of guessing potential downside, VaR condenses complex market risk factors into a single monetary amount or percentage.
According to regulatory frameworks established by institutional bodies such as the Bank for International Settlements (BIS), risk metrics like VaR provide an essential baseline for determining capital reserve requirements.
A standard VaR assessment is always defined by three core variables:
- Time Horizon: The specific time frame over which the risk is measured (e.g., 1 day, 10 days, or 1 year).
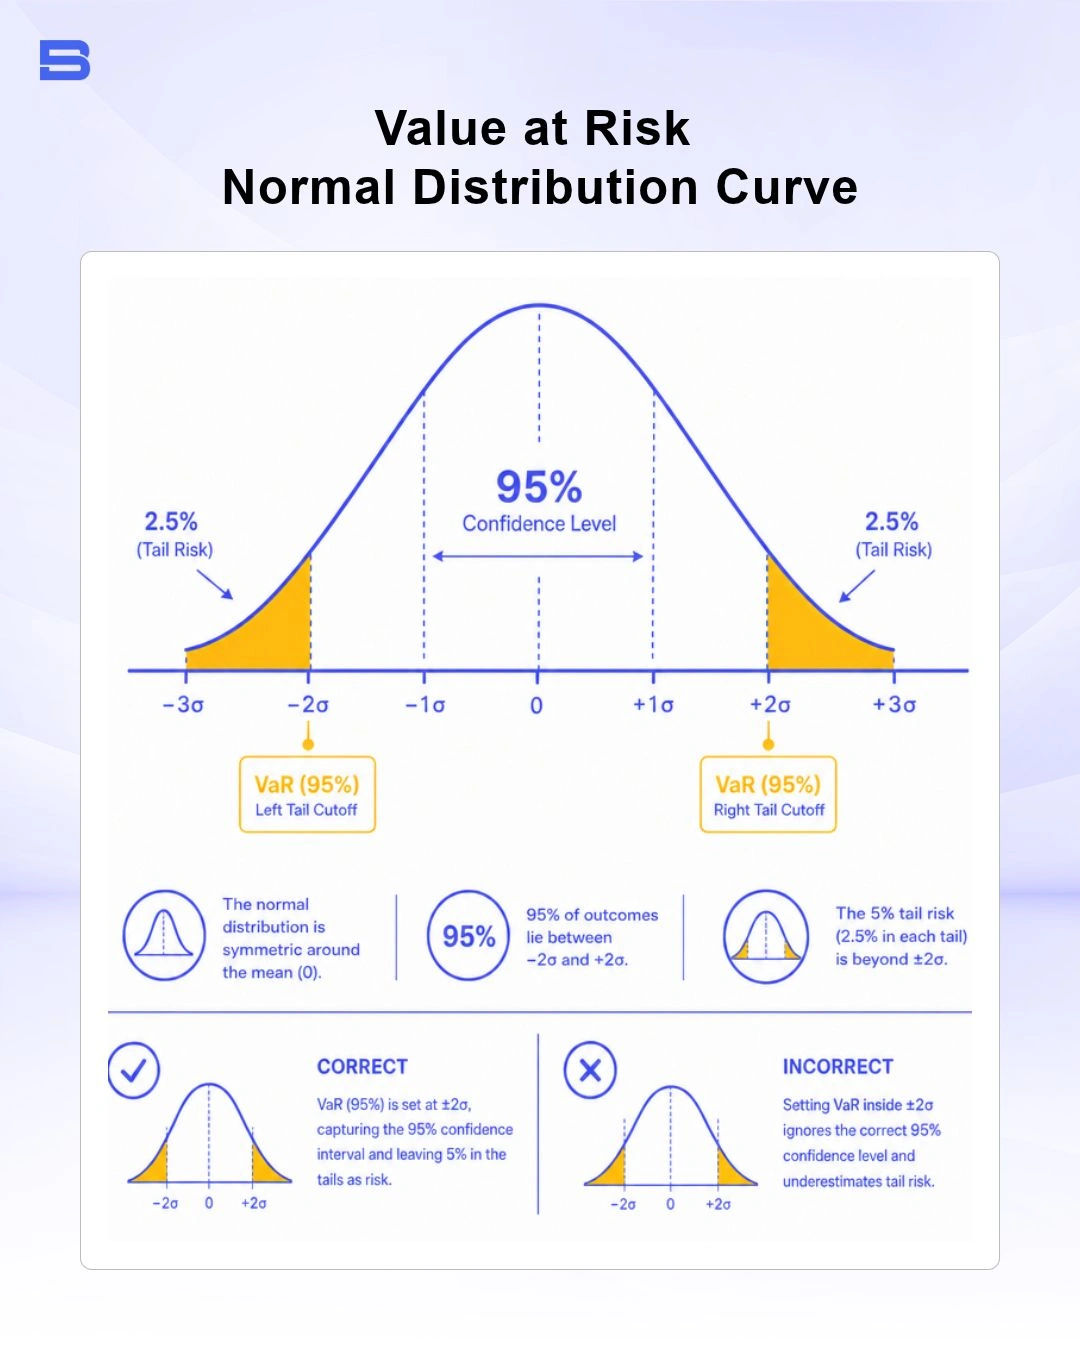
- Confidence Level: The statistical probability that the loss will not exceed the calculated amount (typically 95% or 99%).
- Potential Loss Amount: The dollar value (or percentage of total portfolio capital) at risk of being lost.
For example, if a portfolio has a 1-day 95% VaR of $3,000, it means there is a 95% statistical probability that the portfolio will not lose more than $3,000 in a single trading day. Conversely, it implies a 5% chance that the loss could exceed $3,000 under normal market conditions.
Key Components of Value at Risk
Understanding how VaR functions requires examining its primary inputs:
- Portfolio Value: The baseline capital subject to risk. A higher portfolio balance naturally results in a larger nominal dollar loss at the same confidence level.
- Confidence Level: The statistical threshold selected for the risk measurement. Choosing a 99% confidence level provides a wider safety buffer than a 95% level, resulting in a higher reported VaR figure.
- Time Horizon: The duration over which price changes are evaluated. Liquid trading assets typically use a 1-day time horizon, whereas institutional portfolios or multi-asset funds often apply a 10-day or 30-day time horizon.
Value at Risk Calculation Methods with Worked Examples
To calculate value at risk, analysts and risk managers rely on three primary methodologies. Each method uses a distinct statistical framework to process historical prices, market volatility, and asset returns.
Variance-Covariance (Parametric) Method
The variance-covariance method (also known as the parametric method) assumes that asset returns follow a standard normal distribution (bell curve). This approach calculates risk using mean return, standard deviation (volatility), and asset correlations.
The parametric VaR formula is expressed as:
VaR = P x Z x σ x √t
Where:
- P = Total Portfolio Value
- Z = Z-score corresponding to the chosen confidence level (e.g., 1.645 for 95%, 2.326 for 99%)
- σ = Daily volatility (standard deviation of daily returns)
- t = Time horizon in days
Worked Example (Parametric VaR):
- Portfolio Value (P): $100,000
- Confidence Level: 95% (Z = 1.645)
- Daily Volatility (σ): 2% (0.02)
- Time Horizon (t): 1 day
VaR = $100,000 x 1.645 x 0.02 x √1 = $3,290
Takeaway: Under normal market conditions, there is a 95% certainty that daily losses will not exceed $3,290.
Historical Simulation Method
The historical method VaR model avoids relying on normal distribution assumptions. Instead, it uses actual historical daily returns of the portfolio assets over a specified period (e.g., 250 trading days) and sorts them from worst to best.
To find the 95% 1-day VaR from 250 historical daily returns, you locate the 5th percentile worst return (the 12.5th worst daily performance, usually rounded to the 13th worst day).
Worked Example (Historical Simulation):
- Portfolio Value: $100,000
- Historical Data: Past 250 trading days
- Worst 5% Threshold (13th worst return day): -2.8%
VaR = $100,000 x 0.028 = $2,800
Takeaway: Based on real past price movements, 95% of trading days produced losses lower than $2,800.
Monte Carlo Simulation
The Monte Carlo simulation VaR methodology uses computer algorithms to simulate tens of thousands of potential future price paths for a portfolio based on defined random variables, historical volatilities, and correlations.
Once all simulated outcomes are generated, returns are ordered to identify the loss threshold at the chosen confidence level. While computationally intensive, Monte Carlo simulation is well-suited for complex portfolios containing options, derivatives, or non-linear instruments.
Practical Application of VaR in Trading
While institutional trading desks use VaR to meet regulatory capital mandates outlined by global standards like the International Organization of Securities Commissions (IOSCO), individual traders can adapt the metric for daily risk management.
Key applications include:
- Position Sizing: If your 1-day VaR limit is set at $1,000 across all active positions, you can reduce position sizes on highly volatile assets to keep the overall portfolio risk within limits.
- Asset Allocation: Comparing VaR across different asset classes helps identify which positions contribute disproportionately to downside risk.
- Risk-Adjusted Sizing Rules: Combining VaR limits with mathematical models such as the Kelly criterion helps ensure capital allocation scales efficiently relative to win rates and expected payouts.
Value at Risk Limitations and Downside Risks
Despite its widespread use, Value at Risk has notable structural limitations. Relying solely on VaR without acknowledging its boundaries can lead to severe underestimation of real market risk.
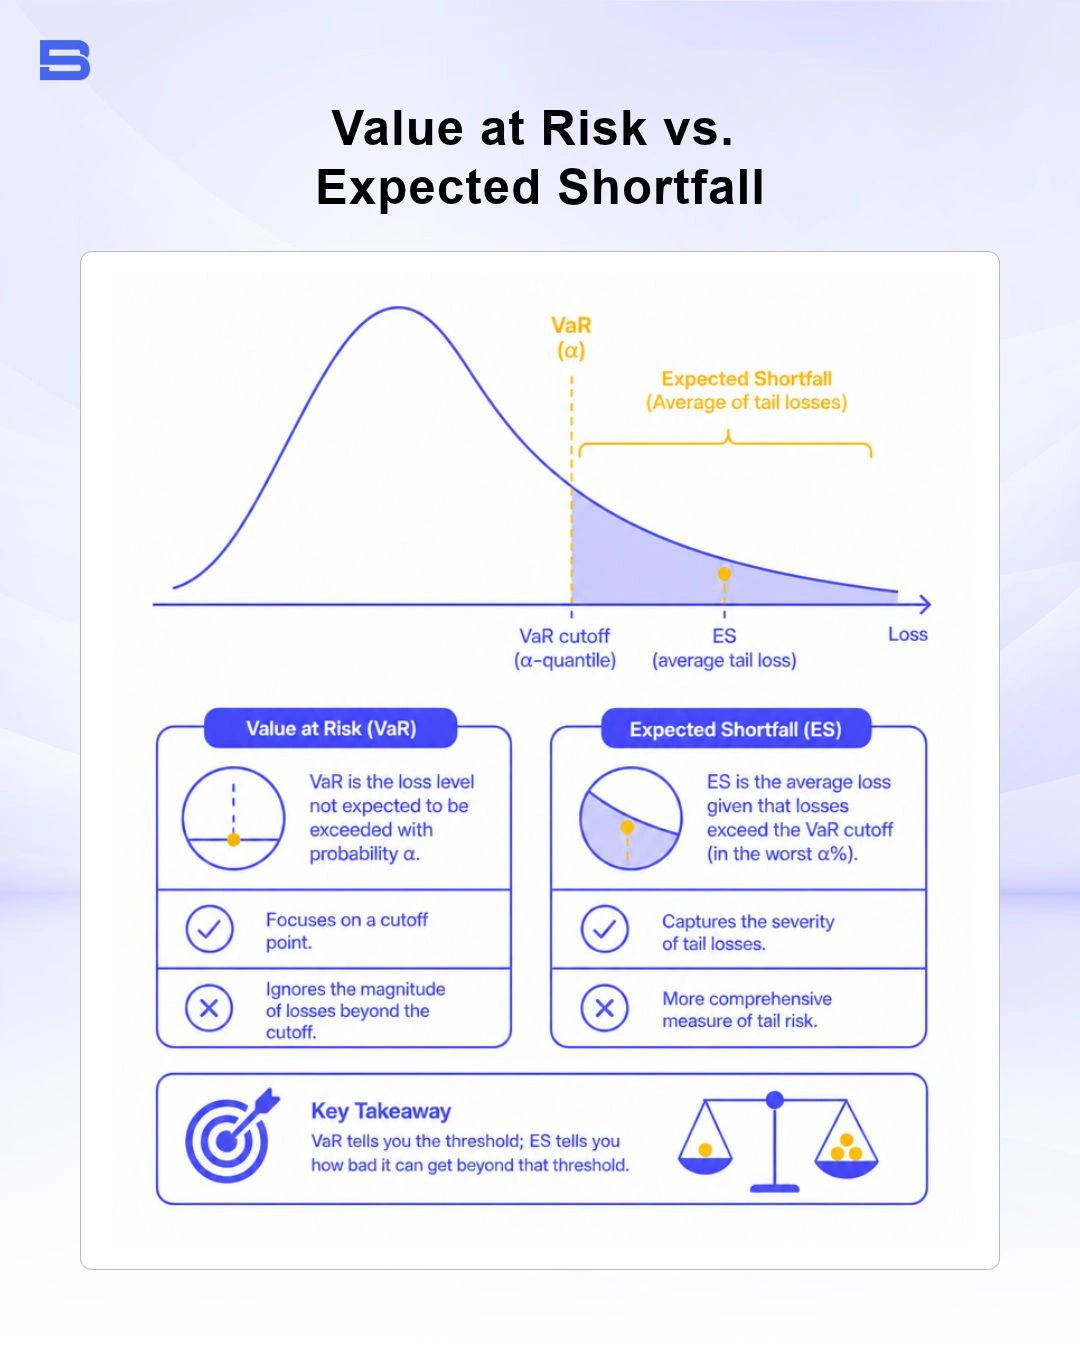
- Ignorance of Tail Risk: VaR tells you the minimum loss expected on worst-case days, but says nothing about how severe losses can become beyond that threshold. A 95% 1-day VaR of $3,000 means losses will exceed $3,000 on 5% of trading days—it does not prevent those outlier losses from reaching $10,000 or $50,000 during extreme market crashes.
- Distribution Assumptions: The parametric method assumes a normal distribution. Real financial markets exhibit "fat tails" (skewness and excess kurtosis), meaning extreme movements happen far more frequently than standard statistical models predict.
- Historical Bias: Past price behavior does not guarantee future results. Black swan events, sudden liquidity crises, and unheralded macroeconomic shifts can cause losses that exceed historical statistical boundaries, triggering sharp capital drawdown.
Beyond VaR: Conditional VaR (CVaR) or Expected Shortfall
To address the tail risk limitation, modern risk managers supplement VaR with Conditional VaR (CVaR), also known as Expected Shortfall.
Where VaR asks "What is the minimum loss expected on the worst 5% of days?", Expected Shortfall asks "When losses breach the VaR threshold, what is the average loss expected in that tail end?"
Evaluating Expected Shortfall provides a clearer picture of catastrophic loss scenarios, ensuring portfolios remain resilient even during extreme stress events.
Comparing VaR with Other Risk Metrics
Value at Risk measures potential absolute dollar loss over a given timeframe. However, evaluating a trading strategy requires comparing VaR with other standardized risk and performance metrics.
- Risk-Adjusted Return Metrics: While VaR measures raw downside potential, metrics like the Sharpe ratio and Sortino ratio evaluate return generated per unit of total or downside risk.
- Benchmark Relative Performance: Metrics such as the Treynor ratio and information ratio measure performance relative to market benchmarks or systematic risk, whereas VaR focuses on absolute loss thresholds.
- Systematic Market Exposure: The beta coefficient measures an asset's sensitivity relative to the broader market, whereas value at risk calculates specific portfolio loss potential regardless of market direction.
The Bottom Line
Value at Risk is a foundational quantitative tool that brings clarity to portfolio risk management by standardizing downside potential into a single readable figure. However, VaR is not a bulletproof shield against market losses. To build a resilient trading strategy, pair VaR calculations with stress testing, position sizing rules, and tail-risk metrics like Expected Shortfall.
- How to Build an Investment Plan That Actually Works for You?
- What Is the MACD Indicator and How to Use It
- What Is a Wedge Pattern in Trading?
- What Is Ichimoku Cloud Strategy? A Complete Trading System
- Mastering Elliott Wave Theory: Rules and Trading Strategies
- News Trading: Strategies, Execution Risks, and Risk Control
- What Is an Iron Condor Options Strategy?
- Backtesting Explained: What It Is and Why It Really Matters
- Grid Trading: Mechanics, Parameters, and Risk Strategies
- What Is Breakout Trading and How Does It Work?
- Mean Reversion: Technical Strategies and Risk Frameworks
- Momentum Trading: Indicators, Strategies, and Risk Control
- Hammer Candlestick: Structure, Meaning, and Strategy
- Doji Candlestick: Types, Signals, and Trading Strategies
- What Is the Sharpe Ratio and How to Calculate It
- What Is VWAP and How Do Traders Use It?
- Trade the Ascending Triangle: A Step-by-Step Practical Guide
- What Is the Stochastic Oscillator and How to Use It
- How to Trade the Descending Triangle Pattern
- High Frequency Trading: Speed, Algorithms, and Market Impact
- What Is Volume Profile and How to Use It in Trading
- What Is a Morning Star Pattern Candlestick?
- Trade with Parabolic SAR: A Practical Analysis Guide
- Evening Star Pattern: Structure, Rules, and Risk Controls
- Kelly Criterion: Formula, Position Sizing, and Risk
- What Is the NYSE Minimum Trading Price? Rules Explained
Disclaimer: The content on this page is intended for educational and informational purposes only. It does not constitute financial, investment, tax, or legal advice, and should not be interpreted as a recommendation to buy, sell, or hold any financial instrument or asset. Trading and investing involve significant risk, including the possible loss of your entire capital. Products such as forex, CFDs, and cryptocurrencies carry additional risks due to leverage, high volatility, and limited regulatory protection in some jurisdictions. Past performance of any financial instrument does not guarantee future results. Any market views, forecasts, or opinions expressed are those of the author at the time of writing and may not reflect current market conditions. Platform features, fees, and regulatory status are subject to change — always verify information directly with the relevant provider or regulator before making any financial decision. BrokerSpecs may receive compensation from third parties featured on this site. Always conduct your own due diligence and consider seeking advice from a licensed financial professional before investing. Portions of this article were prepared with the assistance of AI tools and reviewed by our editorial team before publication.