


Related Tags
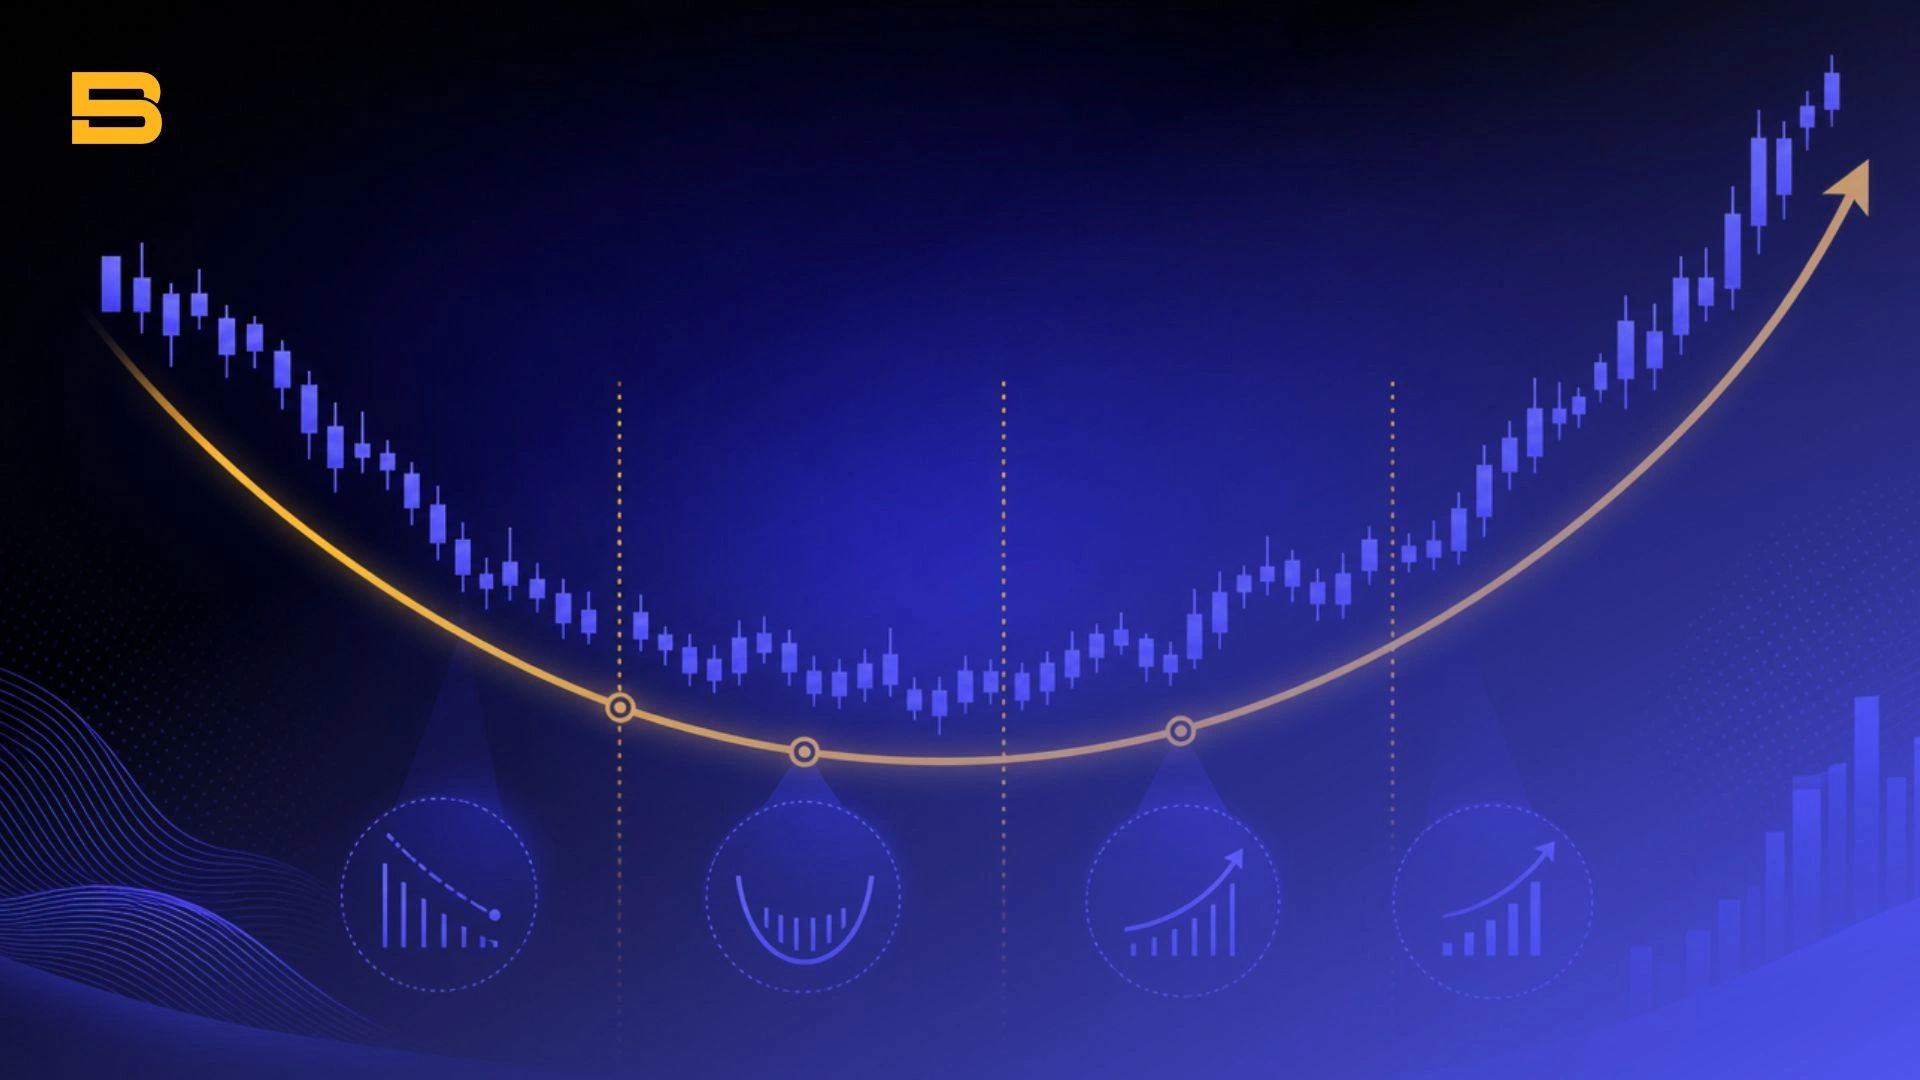
You have likely watched an asset fall for months, feeling as though the selling pressure will never end. Then, almost imperceptibly, the steep drops flatten out into a quiet range, and buyers begin slowly driving the price back upward. This gradual shift creates a distinct U-shaped curve on your price chart—a rounding bottom pattern signaling that the long downtrend may finally be coming to an end.
Rounding Bottom Pattern: Meaning and How It Works
This chart formation—often referred to as a "saucer" or "bowl"—is a long-term bullish reversal technical setup that represents a gradual shift from seller dominance to buyer control. Unlike sharp V-shaped reversals where price bounces violently off a single low, a rounding bottom reflects an extended period of market consolidation where aggressive selling dries up, and gradual accumulation takes place.
Is a rounding bottom bullish? Yes. A rounding bottom is generally interpreted by technical analysts as a bullish reversal pattern, suggesting a potential transition from a declining trend to an upward trend. This interpretation is consistent with the Chartered Financial Analyst (CFA) Institute's broader description of reversal patterns as chart formations that can signal the end of an existing trend.
However, the CFA Institute does not specifically identify the rounding bottom as one of the most reliable reversal patterns, so such a claim should be avoided without additional empirical evidence. The psychological progression behind the pattern involves three distinct market phases:
- Seller Exhaustion: The initial steep downtrend loses momentum as panic selling ends and long-term holders absorb remaining supply.
- Equilibrium and Accumulation: Price moves sideways in a shallow trough. Trading volume drops significantly as neither buyers nor sellers hold a strong edge.
- Buyer Dominance: Institutional investors and patient traders steadily accumulate positions, slowly raising price levels toward the prior resistance level.
Key Characteristics and Identification Rules
To spot a valid rounding bottom pattern on your chart, you must verify four structural components:
- Left Lip: The initial peak or high point that marks the start of the final decline into the bowl.
- The Trough (Bowl): The smooth, curved low point of the pattern where price consolidates over several weeks or months.
- Right Lip: The price recovery phase that ascends back toward the horizontal price level established by the left lip.
- Neckline Resistance: The horizontal line drawn across the highs of the left and right lips. A breakout above this level confirms the pattern.
The Role of Volume in Pattern Validation
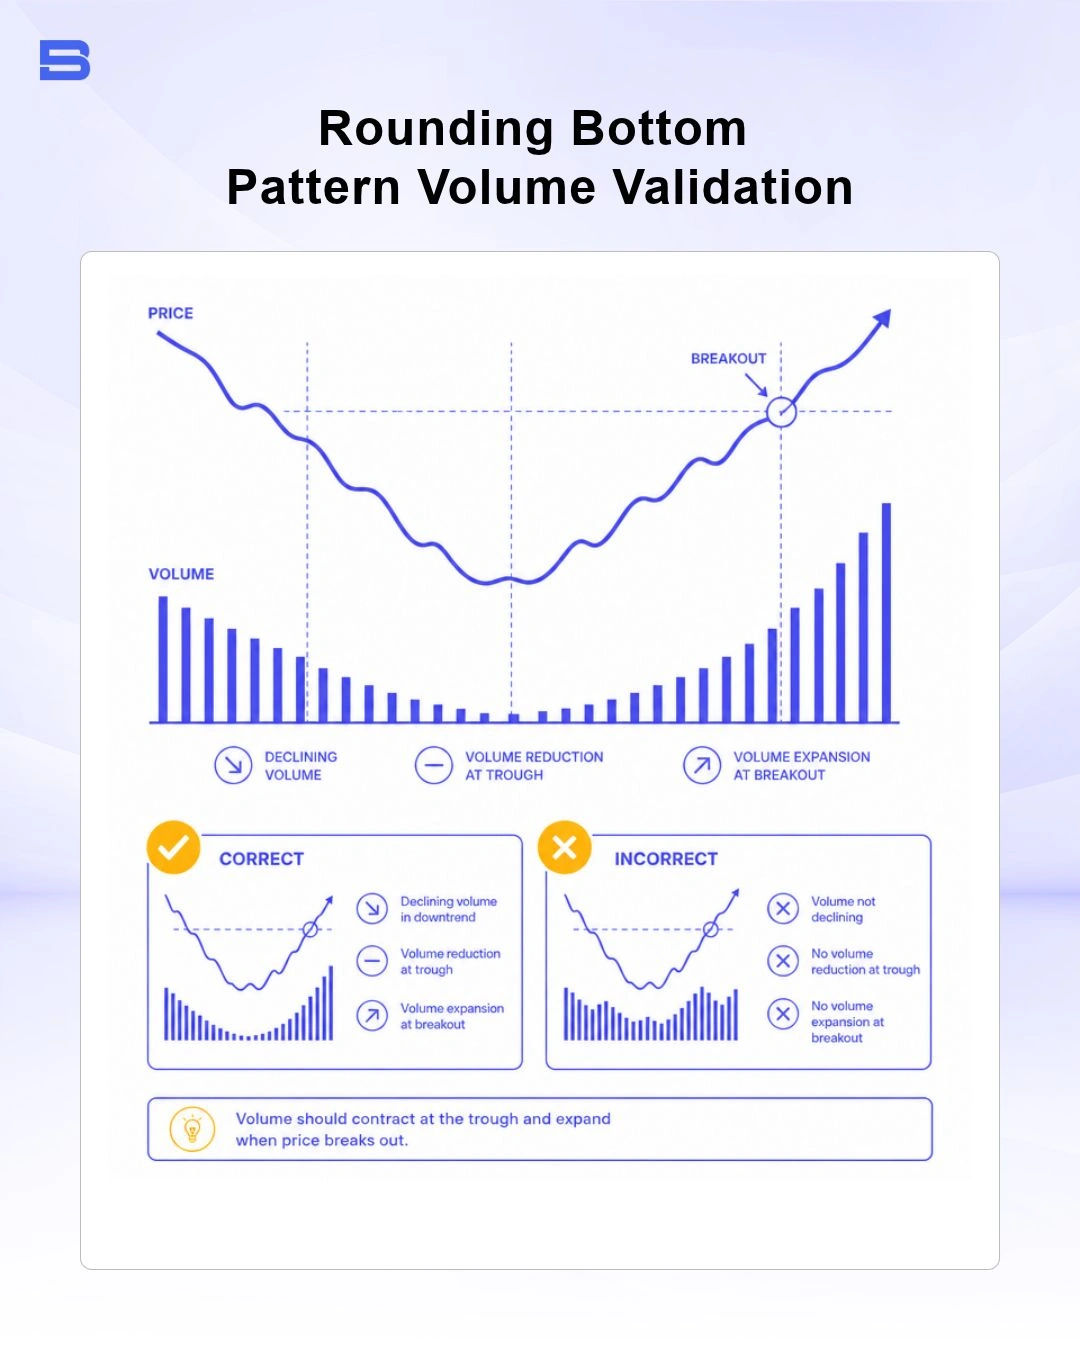
Price action alone is insufficient to confirm a rounding bottom pattern; volume behavior provides crucial confirmation. Volume should broadly mirror the price trajectory, forming a distinct U-shape along the bottom histogram:
- Left Lip Phase: High initial trading volume during the end of the downtrend as sellers exit their positions.
- Trough Phase: Volume dries up completely at the bottom of the bowl, indicating an absence of selling pressure and minimal volatility.
- Right Lip Phase: Trading volume expands progressively as buyers enter the market and drive prices higher.
- Breakout Phase: A decisive volume surge above the average level must accompany the price candle breaking above the neckline. Without expanding volume, the risk of a false breakout increases significantly.
How to Trade the Rounding Bottom Pattern: Step-by-Step Execution
Trading a rounding bottom pattern requires patience, as attempting to anticipate the bottom before the right lip develops often leads to tied-up capital or premature losses.
Follow this execution roadmap once the pattern begins forming:
- Identify the Formation: Confirm the U-shaped price curve on daily or weekly charts along with declining volume at the trough.
- Draw the Neckline: Connect the highest price point of the left lip to the peak where the right lip begins consolidating.
- Wait for the Trigger: Choose your entry style—either an aggressive entry on a daily candle closing above the neckline with heavy volume, or a conservative entry on the first price retest of the broken neckline.
- Set Risk Parameters: Place your stop-loss order below the lowest point of the breakout candle or beneath a recent swing low (a short-term dip in price) inside the right lip.
Measuring Profit Targets and Setting Stop Losses
The standard technical measurement rule uses the depth of the bowl to calculate the conservative minimum price target:
Profit Target = Neckline Price + (Neckline Price - Trough Price)
Consider a scenario where an equity stock forms a rounding bottom pattern:
- Neckline Resistance: $150
- Lowest Trough Price: $100
- Pattern Depth: $150 - $100 = $50
- Measured Profit Target: $150 + $50 = $200
- Invalidation Level / Stop-Loss: $142 (placed just below the broken neckline)
In this scenario, entering at $151 with a stop-loss at $142 risks $9 per share to capture a potential $49 move toward $200, establishing an attractive 1:5.4 risk-to-reward setup.
Leverage amplifies your returns when you are right, but it accelerates capital destruction just as quickly when the market moves against you—leverage limits vary widely by broker, asset class, and jurisdiction, so always confirm your account's specific ratio before sizing a position.
Rounding Bottom vs. Cup and Handle: Key Differences
Traders frequently confuse the rounding bottom with the cup and handle pattern because both feature a U-shaped price curve. However, their structural behavior and consolidation mechanics differ.
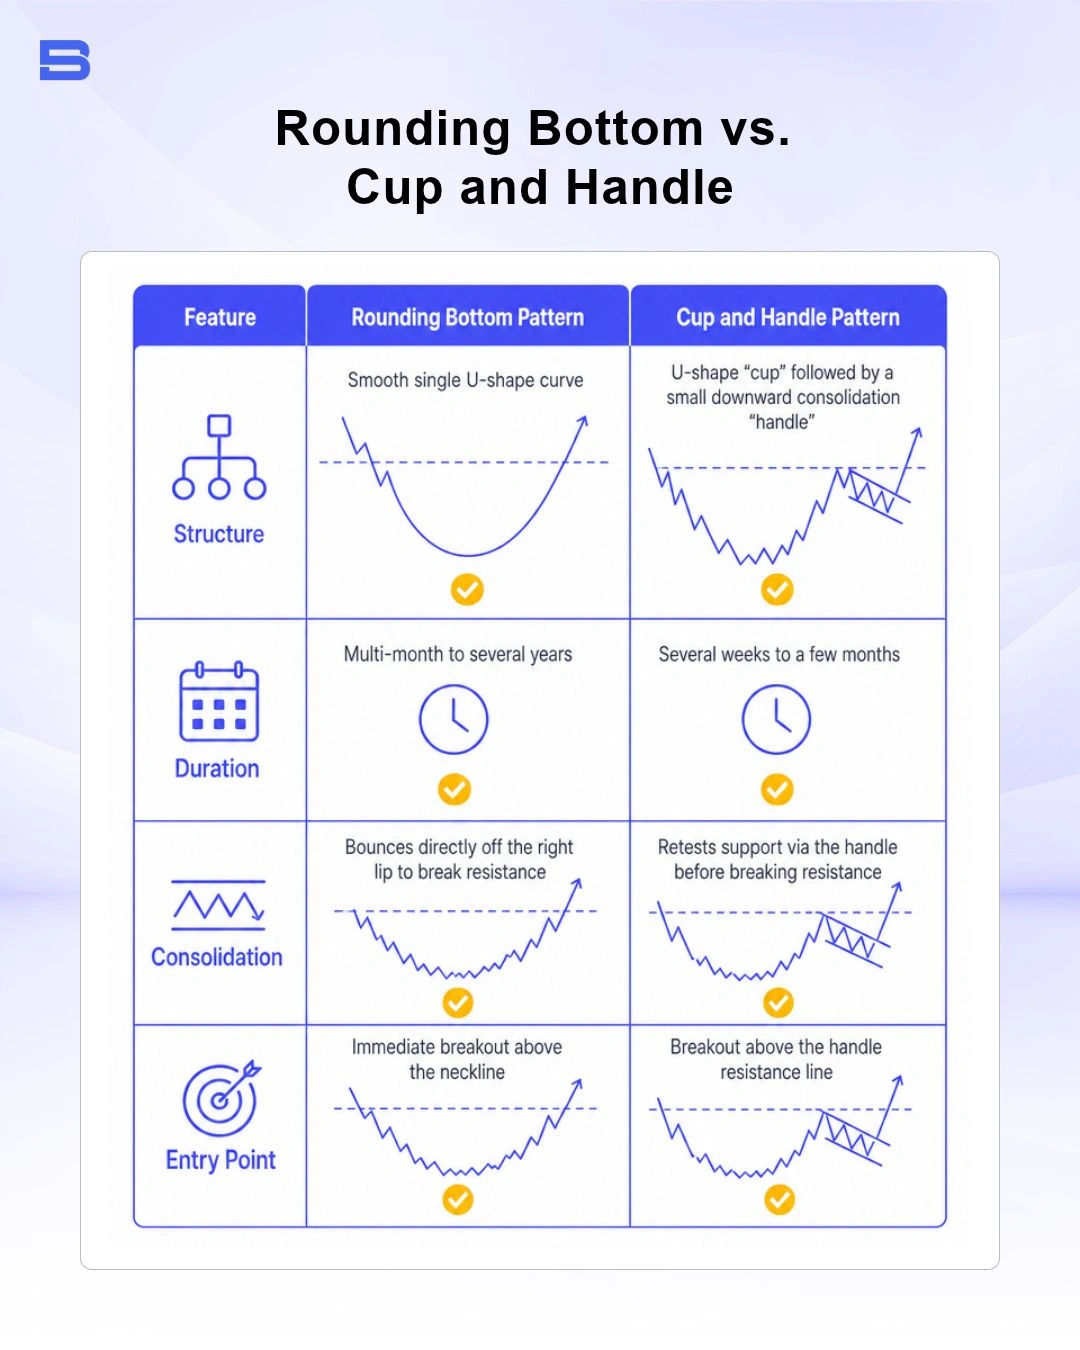
While a rounding bottom moves directly from the right lip into a trend reversal, a cup and handle pauses at resistance to form a short downward channel before attempting its breakout.
Comparing Reversal Patterns: Rounding Bottom vs. Double Top and Triangle Formations
To put the rounding bottom into technical perspective, compare it against other classic price formations:
- Rounding Bottom vs. Double Top Pattern: While a double top pattern forms two quick price peaks separated by a central trough to signal a bearish reversal, a rounding bottom is a slow, single-trough bullish reversal pattern.
- Rounding Bottom vs. Triangles: Continuation patterns like the ascending triangle or descending triangle represent short-term price compression between converging trendlines. A rounding bottom spans a much longer timeframe and marks a structural trend change.
- Rounding Bottom vs. Flags and Wedges: Tight consolidation patterns like a flag pattern or wedge pattern typically resolve within days or weeks as momentum continuations, whereas a rounding bottom represents a complete sentiment overhaul over months.
Risks, Limitations, and False Breakout Management
While a rounding bottom offers strong risk-reward potential, it is not without trading risks. Major limitations include:
- Time Decay and Inefficiency: The pattern can take months or years to complete, tying up capital in sideways market conditions.
- False Breakouts (Bull Traps): Price may temporarily cross above the neckline only to reverse sharply back inside the bowl due to low institutional volume.
- Subjectivity in Identification: Drawing the curved baseline can be subjective, leading traders to mistake long sideways ranges for valid rounding bottoms.
To manage false breakouts, wait for a daily or weekly candle close above the neckline paired with a volume surge exceeding the 20-day volume moving average.
Conclusion
This setup is a bullish reversal formation that signals a gradual shift from selling pressure to buying interest. Its curved structure develops over an extended period, distinguishing it from sharper reversal patterns such as a V-shaped bottom. Traders can use the pattern to identify potential trend changes, but confirmation through a breakout, volume, and broader market context can help reduce the risk of false signals.
- How to Build an Investment Plan That Actually Works for You?
- What Is the MACD Indicator and How to Use It
- What Is a Wedge Pattern in Trading?
- What Is Ichimoku Cloud Strategy? A Complete Trading System
- Mastering Elliott Wave Theory: Rules and Trading Strategies
- News Trading: Strategies, Execution Risks, and Risk Control
- What Is an Iron Condor Options Strategy?
- Backtesting Explained: What It Is and Why It Really Matters
- Grid Trading: Mechanics, Parameters, and Risk Strategies
- What Is Breakout Trading and How Does It Work?
- Mean Reversion: Technical Strategies and Risk Frameworks
- Momentum Trading: Indicators, Strategies, and Risk Control
- Hammer Candlestick: Structure, Meaning, and Strategy
- Doji Candlestick: Types, Signals, and Trading Strategies
- What Is the Sharpe Ratio and How to Calculate It
- What Is VWAP and How Do Traders Use It?
- Trade the Ascending Triangle: A Step-by-Step Practical Guide
- What Is the Stochastic Oscillator and How to Use It
- How to Trade the Descending Triangle Pattern
- High Frequency Trading: Speed, Algorithms, and Market Impact
- What Is Volume Profile and How to Use It in Trading
- What Is a Morning Star Pattern Candlestick?
- Trade with Parabolic SAR: A Practical Analysis Guide
- Evening Star Pattern: Structure, Rules, and Risk Controls
- Kelly Criterion: Formula, Position Sizing, and Risk
- What Is the NYSE Minimum Trading Price? Rules Explained
Disclaimer: The content on this page is intended for educational and informational purposes only. It does not constitute financial, investment, tax, or legal advice, and should not be interpreted as a recommendation to buy, sell, or hold any financial instrument or asset. Trading and investing involve significant risk, including the possible loss of your entire capital. Products such as forex, CFDs, and cryptocurrencies carry additional risks due to leverage, high volatility, and limited regulatory protection in some jurisdictions. Past performance of any financial instrument does not guarantee future results. Any market views, forecasts, or opinions expressed are those of the author at the time of writing and may not reflect current market conditions. Platform features, fees, and regulatory status are subject to change — always verify information directly with the relevant provider or regulator before making any financial decision. BrokerSpecs may receive compensation from third parties featured on this site. Always conduct your own due diligence and consider seeking advice from a licensed financial professional before investing. Portions of this article were prepared with the assistance of AI tools and reviewed by our editorial team before publication.