


- How to Build an Investment Plan That Actually Works for You?
- What Is the MACD Indicator and How to Use It
- What Is a Wedge Pattern in Trading?
- What Is Ichimoku Cloud Strategy? A Complete Trading System
- Mastering Elliott Wave Theory: Rules and Trading Strategies
- News Trading: Strategies, Execution Risks, and Risk Control
- What Is an Iron Condor Options Strategy?
- Backtesting Explained: What It Is and Why It Really Matters
- Grid Trading: Mechanics, Parameters, and Risk Strategies
- What Is Breakout Trading and How Does It Work?
- Mean Reversion: Technical Strategies and Risk Frameworks
- Momentum Trading: Indicators, Strategies, and Risk Control
- Hammer Candlestick: Structure, Meaning, and Strategy
- Doji Candlestick: Types, Signals, and Trading Strategies

Entering a trade right as price moves out of a brief consolidation phase allows traders to align with established market momentum. That brief pause is frequently a flag pattern — a widely monitored chart structure in technical analysis.
Recognizing how this continuation structure forms helps you time market entries with precise parameters and clearly defined risk limits.
What Is a Flag Pattern in Trading?
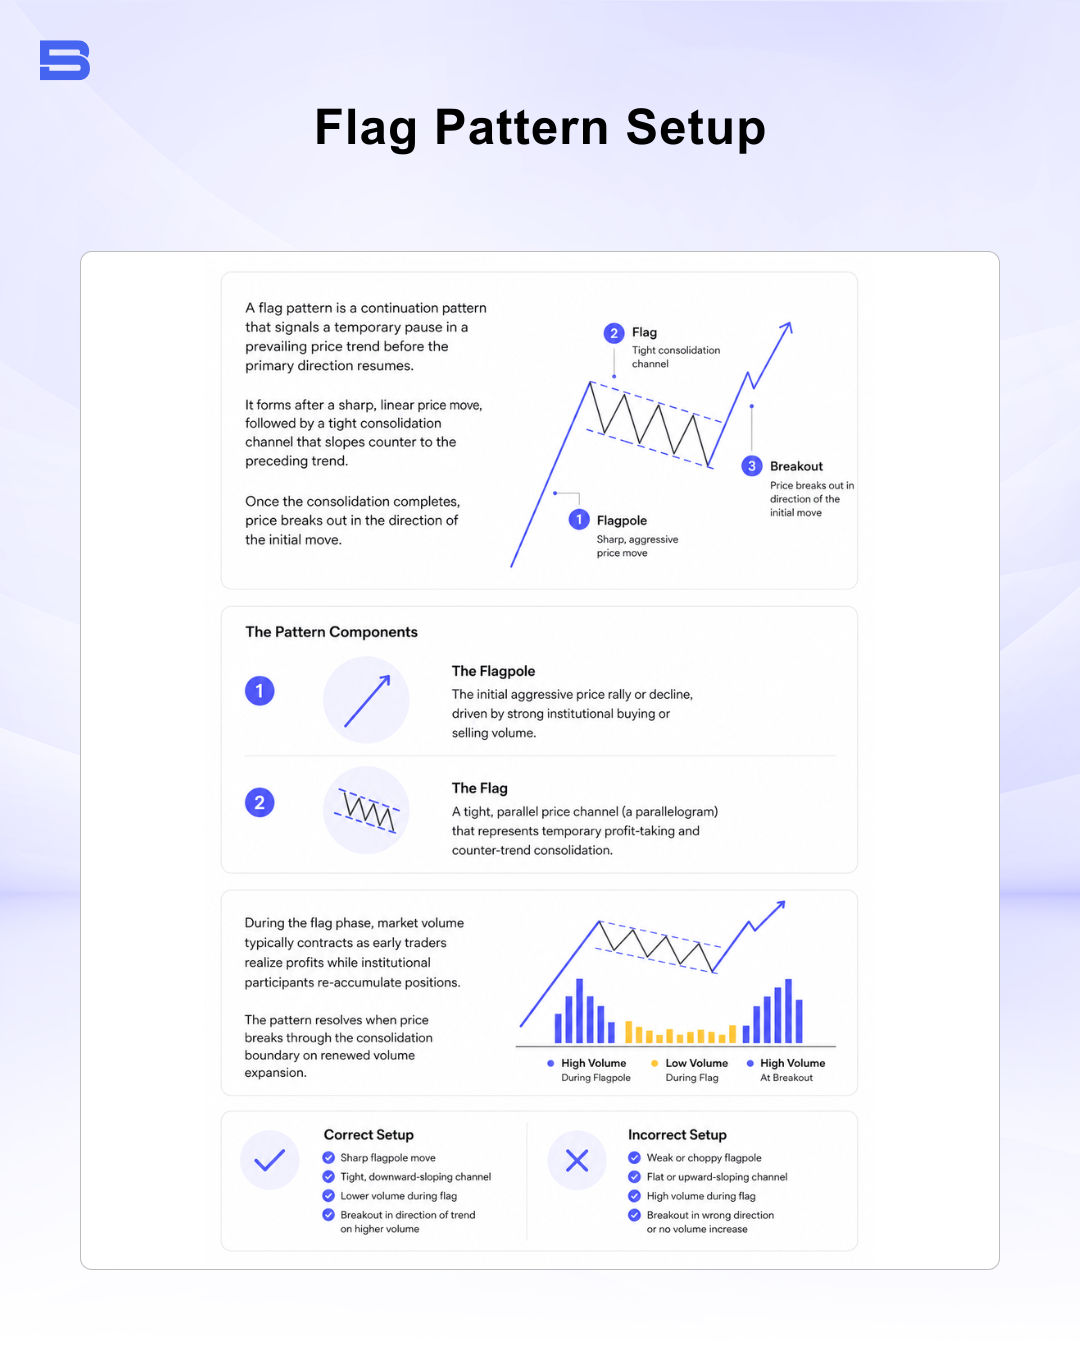
This structure is a technical continuation pattern that signals a temporary pause in a prevailing price trend before the primary market direction resumes. It develops after a sharp, linear price move, forming a tight consolidation channel that slopes counter to the preceding trend. Once the consolidation completes, price breaks out in the direction of the initial move.
The pattern consists of two distinct components:
- The Flagpole: The initial aggressive price rally or decline, driven by strong institutional buying or selling volume.
- The Flag: A tight, parallel price channel (a parallelogram) that represents temporary profit-taking and counter-trend consolidation.
During the flag phase, market volume typically contracts as early traders realize profits while institutional market participants re-accumulate positions. The pattern resolves when price breaks through the consolidation boundary on renewed volume expansion.
What Is a Bullish Flag Pattern?
A bull flag pattern forms during an active uptrend. It begins with a steep, upward price move (the flagpole) as buyers dominate the market. This surge is followed by a downward-sloping consolidation channel defined by parallel resistance and support lines.
This downward slope reflects mild profit-taking rather than aggressive selling. As selling pressure wanes, buyers step in to push the price above the upper resistance boundary, signaling a continuation of the initial upward trend.
What Is a Bearish Flag Pattern?
A bear flag pattern forms during an active downtrend. It starts with a sharp price decline (the flagpole) driven by strong selling momentum. The price then enters an upward-sloping consolidation channel bounded by parallel trendlines.
This upward retracement reflects temporary short-covering or weak buying intervention. Once the corrective movement loses momentum, sellers re-enter the market, breaking price below the lower support line to resume the downward trend.
How to Trade a Flag Pattern: Step-by-Step
Trading a flag pattern requires waiting for structural confirmation rather than anticipating the breakout early.
Step 1: Confirm the Flagpole and Volume
Verify a near-vertical price advance or decline accompanied by elevated trading volume. A weak or gradual initial move does not qualify as a valid flagpole.
Step 2: Identify the Flag Consolidation
Ensure the consolidation channel remains tightly bounded by parallel trendlines. The retracement should ideally stay within 38.2% to 50% of the flagpole's total height. A retracement exceeding 61.8% signals structural weakness and invalidates the pattern. Volume must contract steadily during this consolidation phase.
Step 3: Set Entry, Stop-Loss, and Profit Targets
- Entry: Enter the market when a candle closes beyond the flag boundary (above resistance for a bull flag, below support for a bear flag) accompanied by a surge in trading volume.
- Stop-Loss: Place the stop-loss order just beyond the opposite edge of the flag channel to protect capital if the breakout fails.
- Profit Target (Measured Move): Measure the vertical height of the initial flagpole. Project that exact price distance from the breakout point to establish the price target.
Worked Trade Example (EUR/USD)
Consider a EUR/USD setup on a 1-hour chart:
- Flagpole: Price rallies sharply from 1.0800 to 1.1000 (a 200-pip move).
- Flag: Price consolidates downward in a tight channel to 1.0950 on declining volume.
- Execution: Price breaks above the upper trendline at 1.0970 on strong volume expansion.
- Entry: 1.0970
- Stop-Loss: 1.0930 (below the lower flag boundary; risk = 40 pips)
- Take-Profit Target: 1.1170 (1.0970 breakout point + 200-pip flagpole length; reward = 200 pips)
- Risk-to-Reward Ratio: 1:5
Difference Between a Flag Pattern and a Pennant Pattern
While both structures function as continuation setups, their consolidation geometries differ distinctly.
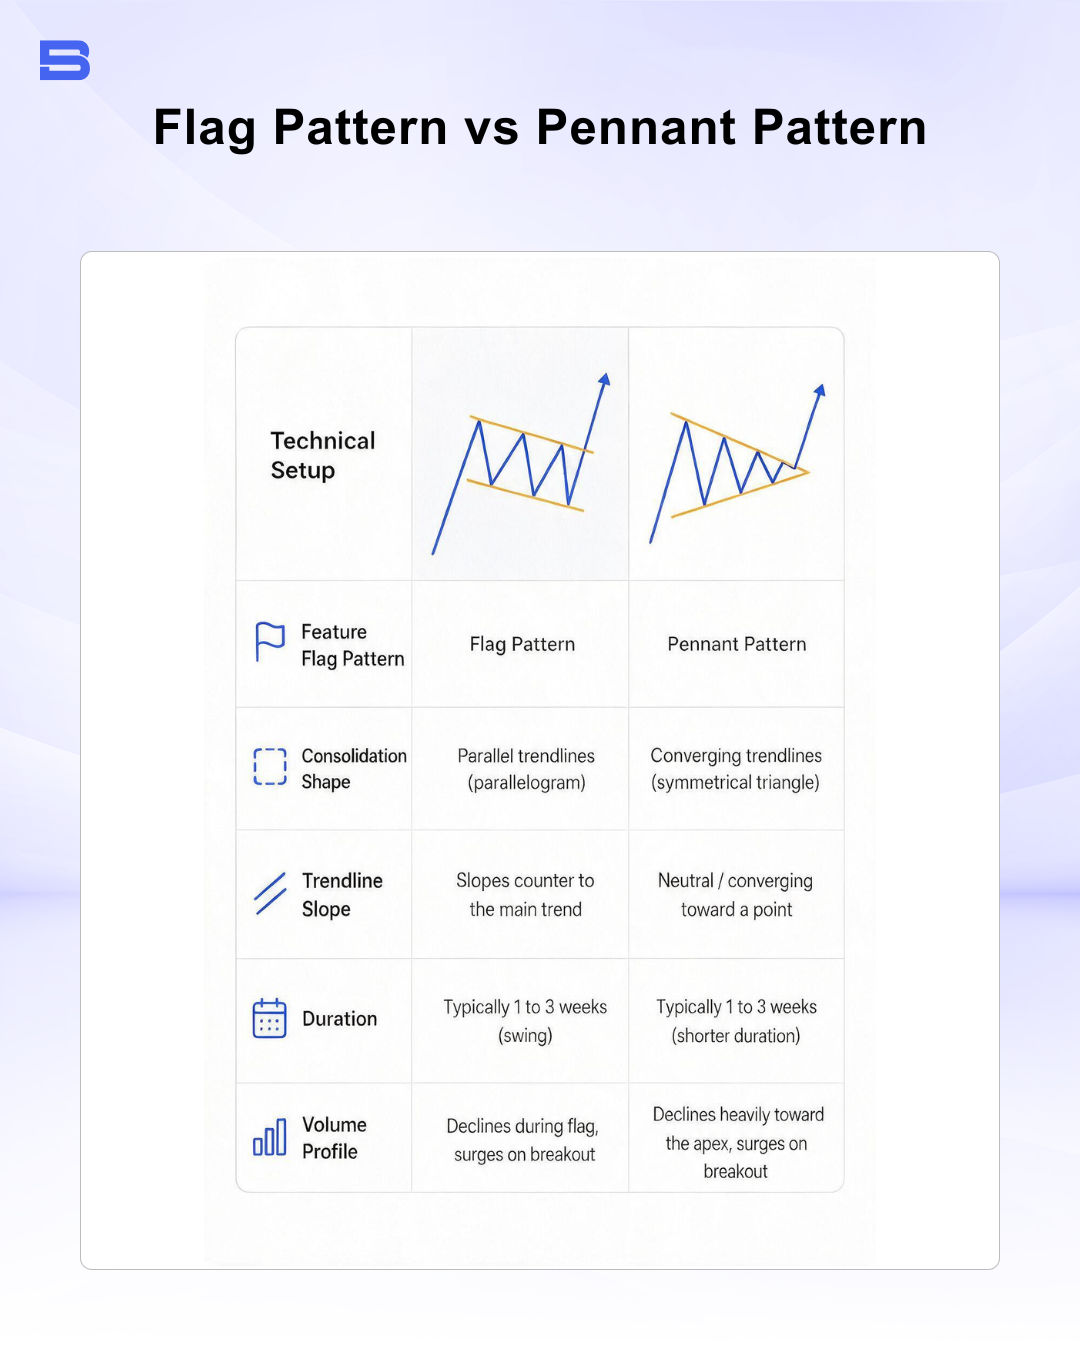 Understanding these geometric differences ensures correct identification when applying technical tools like an ascending triangle or descending triangle alongside chart patterns.
Managing Risk and False Breakouts
A primary risk when trading continuation patterns is a false breakout (fakeout), where price briefly moves beyond the trendline boundary before reversing back into the channel or breaking out in the opposite direction.
To reduce false breakout risk, enforce strict volume confirmation rules:
- High Volume on Flagpole: Confirms true institutional momentum.
- Declining Volume in Flag: Confirms a lack of aggressive counter-trend interest.
- Volume Surge on Breakout: Confirms fresh market participation expanding price directionally.
According to market risk principles outlined by regulatory authorities like the US Commodity Futures Trading Commission (CFTC) and professional standards from the CFA Institute, trading leveraged derivatives during low-liquidity conditions carries substantial capital risk due to slippage and unpredictable price gaps. Always maintain a minimum 1:2 risk-to-reward parameter to ensure winning trades mathematically outweigh historical losses over time.
Comparing Flag Patterns with Other Chart Patterns
Distinguishing flag patterns from similar technical structures prevents premature entries on conflicting signals.
Flag Pattern vs. Double Top Pattern
A flag pattern is a continuation structure that signals a pause before the trend resumes. Conversely, a double top pattern is a major reversal setup that forms at the peak of an uptrend, signaling a complete shift in market direction.
Flag Pattern vs. Triangle Pattern
A flag consolidates within parallel trendlines that slope counter-trend. A triangle pattern forms between converging trendlines, representing a narrowing price range where buyers and sellers reach temporary equilibrium before breaking out.
Flag Pattern vs. Wedge Pattern
A wedge pattern features converging trendlines that both slope in the same direction (either upward or downward), indicating weakening momentum within the move. In contrast, a flag uses strictly parallel lines that channel counter to the dominant move.
Disclaimer: The content on this page is intended for educational and informational purposes only. It does not constitute financial, investment, tax, or legal advice, and should not be interpreted as a recommendation to buy, sell, or hold any financial instrument or asset. Trading and investing involve significant risk, including the possible loss of your entire capital. Products such as forex, CFDs, and cryptocurrencies carry additional risks due to leverage, high volatility, and limited regulatory protection in some jurisdictions. Past performance of any financial instrument does not guarantee future results. Any market views, forecasts, or opinions expressed are those of the author at the time of writing and may not reflect current market conditions. Platform features, fees, and regulatory status are subject to change — always verify information directly with the relevant provider or regulator before making any financial decision. BrokerSpecs may receive compensation from third parties featured on this site. Always conduct your own due diligence and consider seeking advice from a licensed financial professional before investing.