


Related Tags
You are staring at the Euro/US Dollar (EUR/USD) pair on a 5-minute candlestick chart, trying to decide whether a trend is forming or if the market is just churning through random noise. Long wicks shoot up, red candles swallow green ones, and suddenly a clear setup dissolves into intraday chop. For many traders, this constant fluctuation creates emotional fatigue, leading to premature exits or poorly timed entries.
Renko charts were created to solve this specific problem by stripping away time altogether. By building blocks based strictly on fixed price increments, Renko charts filter out market noise and reveal the underlying directional momentum. However, this clarity comes with an important trade-off: eliminating time hides intraday price extremes and wicks, which can mask sudden volatility risks. Understanding how they operate allows you to harness its trend-filtering capabilities while protecting your portfolio from execution traps.
What Is a Renko Chart?
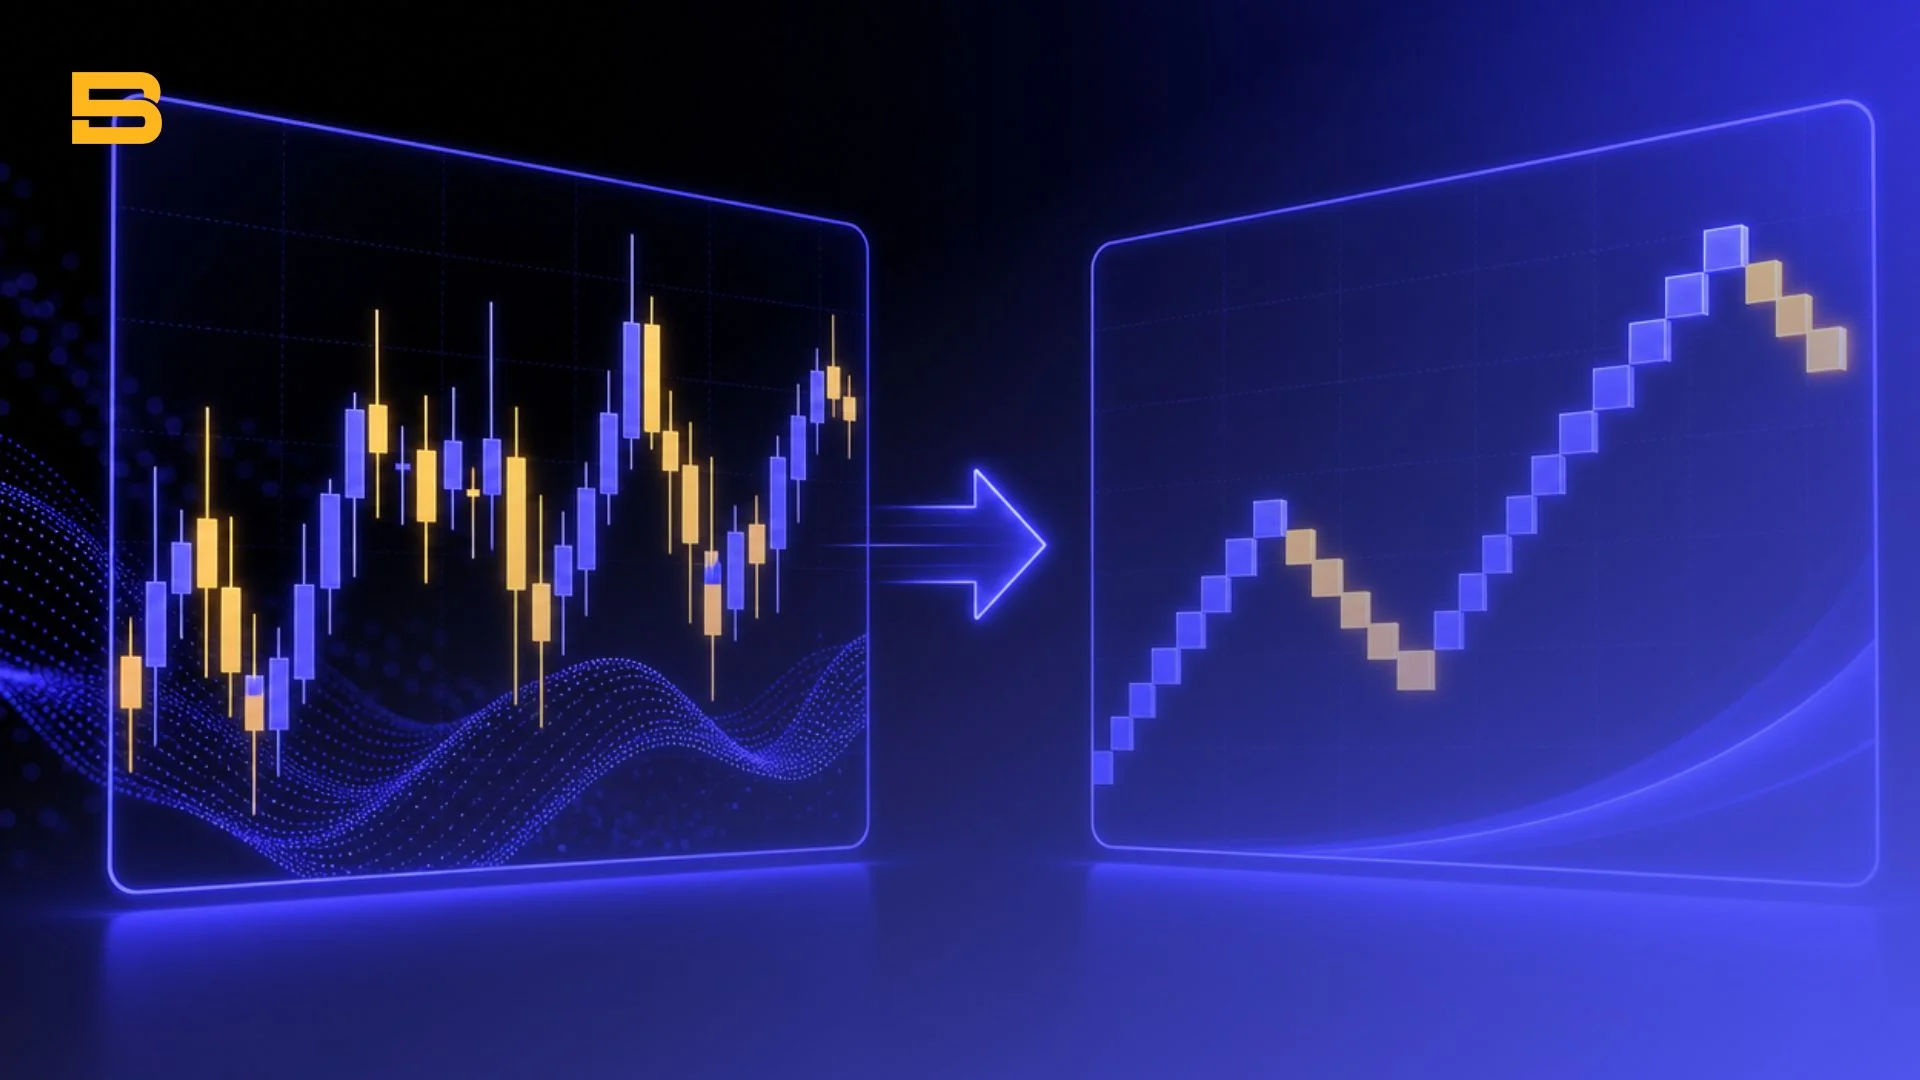
A Renko chart is a time-independent technical charting tool that builds uniform price bricks only when price moves a predetermined distance, completely ignoring the time elapsed. Derived from the Japanese word renga, meaning "brick," it replaces standard time-based bars with a series of visual blocks. A new brick is placed on the chart only after price traverses the full specified brick size.
Traders primarily use it to identify clear trend continuations and clean support or resistance zones. Because time is removed, a single brick might take three minutes to form during high-volatility news events, or three hours during quiet Asian trading sessions. This mechanic helps you avoid overtrading during sideways consolidation.
When trading with it, you look for a sustained series of same-colored bricks to confirm a strong market movement. However, filtered charts can create a false sense of security. Because bricks only print once the full price threshold is achieved, you do not see the erratic fluctuations occurring inside the brick-building process.
For broader professional guidance, the CFA Institute's Code of Ethics and Standards of Professional Conduct stress having a reasonable, well-researched basis for any market analysis, which is a useful principle to apply when reading any chart.
How to Read a Renko Chart: Brick-Building Rules
Reading a Renko chart requires understanding three structural rules: fixed brick construction, color coding, and directional reversal thresholds. Bricks are typically color-coded for quick visual recognition: green (or white) bricks signal bullish upward price movement, while red (or black) bricks signal bearish downward price movement.
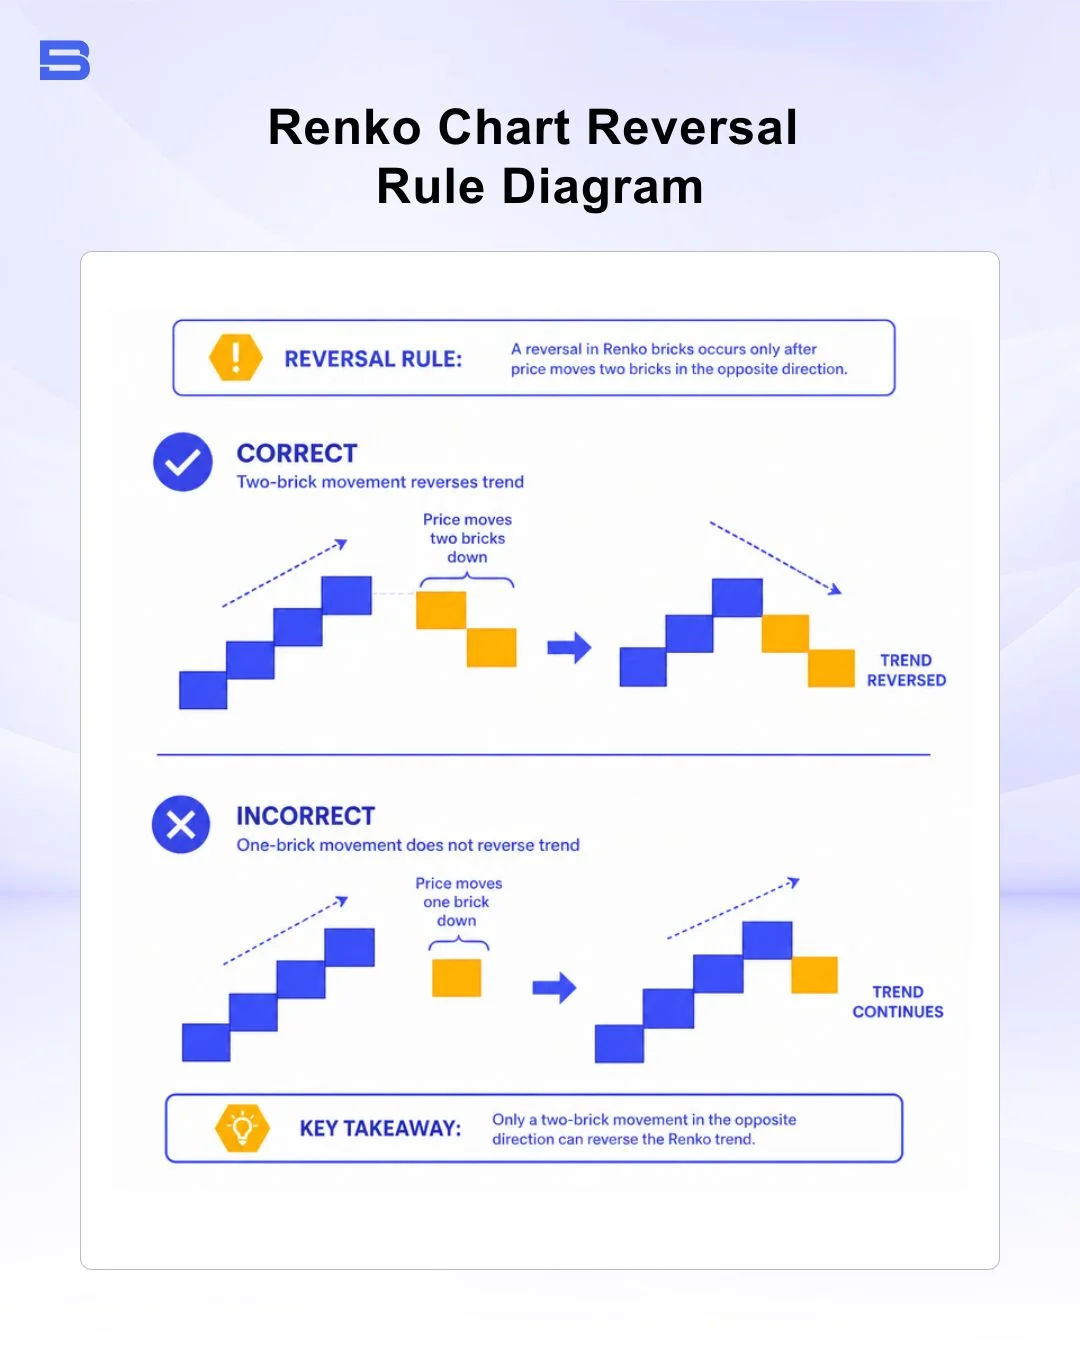
The defining feature of Renko mechanics is the reversal requirement. To print a new brick in the same direction, price only needs to move the designated brick size. However, to print a brick in the opposite direction, price must move two times the brick size from the high or low of the previous brick.
Consider a scenario where you set a fixed brick size of 10 pips on EUR/USD (a pip is the smallest standard price move in a currency pair, or 0.0001 for EUR/USD), and the market turns upward from 1.1000:
- Price rises from 1.1000 to 1.1010 → Brick 1 (Bullish) prints at 1.1010.
- Price rises further from 1.1010 to 1.1025 → Brick 2 (Bullish) prints at 1.1020, while the remaining 5 pips wait unprinted.
- Price drops from 1.1025 down to 1.1005 → No red brick prints yet. Because the last bullish brick printed at 1.1020, price must fall 20 pips (two 10-pip bricks) down to 1.1000 to confirm a bearish reversal brick.
This 2x reversal rule prevents minor pullbacks from constantly changing your chart's visual signal, keeping you aligned with the broader move.
Setting the Brick Size: Fixed Pips vs. ATR (Average True Range)
Choosing the correct brick size determines how effectively your chart filters noise without introducing excessive lag. Charting platforms generally offer two sizing modes:
- Fixed Brick Size: You manually define a constant value, such as 10 pips for forex or $2.00 for a stock. While simple, fixed sizing requires manual adjustment as market volatility expands or contracts over time.
- ATR Sizing: The platform dynamically sets the brick size using the Average True Range indicator. If the 14-period ATR is currently 15 pips, each brick auto-adjusts to 15 pips.
Using fixed bricks on a highly volatile asset can cause rapid brick formation, negating the noise-filtering benefit. Conversely, setting an ATR brick size on live charts introduces a subtle execution risk: if your platform recalculates ATR dynamically on open bricks, live brick boundaries can shift before closing.
To maintain consistent execution, many traders set the ATR value once to determine the baseline, then switch to a fixed brick setting matching that ATR number.
Renko Charts vs. Traditional Time-Based Charts
Standard time-based charts (such as 15-minute or 1-hour candlestick charts) print a new bar at predictable time intervals regardless of price activity. On a quiet afternoon, a standard chart still prints multiple flat candles that clutter your workspace. A Renko chart compresses quiet periods into a single static brick until real buying or selling pushes price across the threshold.
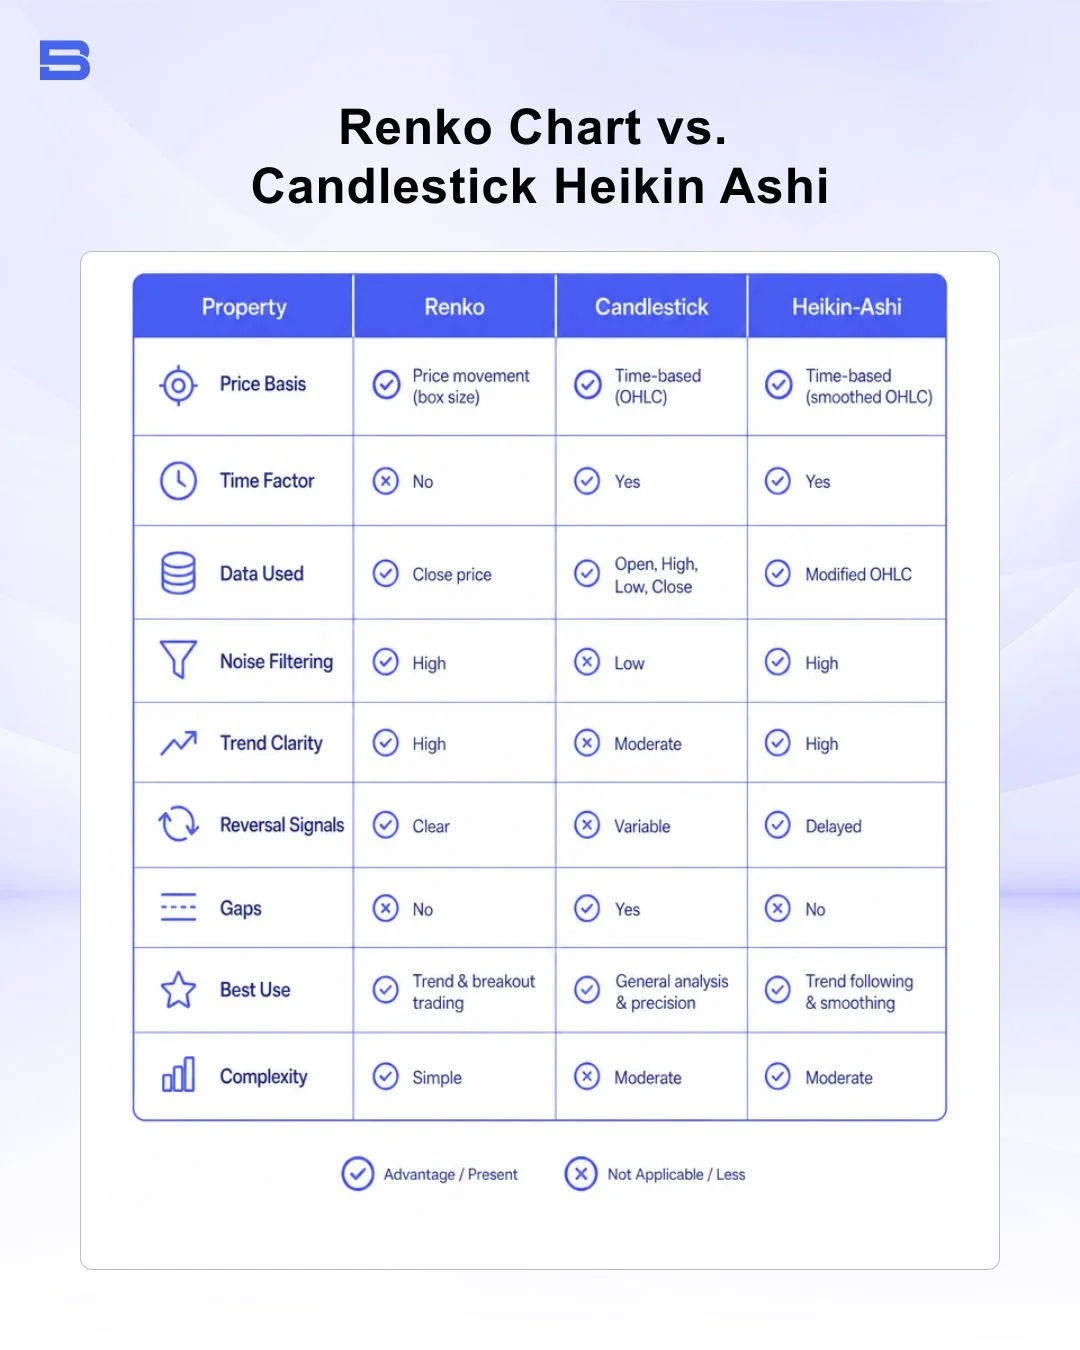
Renko Chart vs. Heikin-Ashi and Candlestick Charts
While standard candlesticks capture every high and low wick within a set timeframe, Heikin Ashi candles smooth out price action by averaging open, high, low, and close values across fixed time periods.
Renko takes smoothing a step further by removing the time axis entirely. Standard candlesticks show precise volatility wicks, Heikin-Ashi shows smoothed time-based trends, and Renko shows pure step-by-step price progress.
Comparing Time-Independent Charts: Renko vs. Point and Figure
Both Renko and point and figure chart setups ignore time, but they structure price movement differently. Point and Figure charts use columns of stacked "X's" (rising price) and "O's" (falling price) to track supply and demand shifts without horizontal brick spacing.
Renko charts, by contrast, construct uniform, brick-shaped blocks that move diagonally across the grid, offering a simpler visual layout for traders transitioning from traditional candlestick charts.
Practical Renko Chart Trading Strategies
Trading effectively involves pairing brick patterns with complementary momentum indicators to confirm entries.
One widely used setup is the Renko Brick Reversal Strategy paired with the Relative Strength Index (RSI) indicator. Because Renko requires a 2x price movement to print a reversal brick, the first opposite-colored brick signals a potential trend shift. To execute this setup:
- Wait for a long bullish run (green bricks) where the RSI reaches overbought territory (above 70).
- Monitor the chart until the first red reversal brick fully closes.
- Verify that the RSI has turned downward out of overbought territory before entering a short position.
- Before entering, place a stop-loss above the top of the last green brick and decide your exit in advance, such as closing the trade if a new green reversal brick prints. Size the position so that a stop-out risks only a small, predetermined portion of your account.
Traders also apply Bollinger Bands to Renko charts to identify volatility breakouts. When Renko bricks compress within narrow Bollinger Bands, it may signal that a larger move is building, although the direction and timing are never guaranteed. Additionally, mapping Fibonacci retracement levels across a clear Renko brick trend can help you spot potential pullback zones where the uptrend may resume, though price does not always respect these levels.
Leverage amplifies both your potential gains and losses—a 2% adverse market move on a 20:1 leveraged position can rapidly consume 40% of your account equity. Because Renko bricks hide intraday wicks, the chart may not show how far price actually traveled during fast-moving news events. A stop-loss placed just beyond a brick could be triggered, or filled at a less favorable price, without the chart clearly showing why.
Regulators like the Financial Conduct Authority (FCA) classify leveraged derivatives such as CFDs as high-risk products and require providers to warn that many retail accounts lose money trading them. Stop-loss orders can help limit losses, but always account for potential slippage during volatile periods.
Is a Renko Chart Right for Your Trading Style?
Renko charts offer a practical way to filter out market noise, isolate sustained trends, and reduce the emotional stress caused by intraday chop. By building uniform price bricks independent of time, they allow you to focus purely on structural support, resistance, and momentum changes.
However, filtering price action comes at the cost of hiding intraday high and low extremes. Successful trading requires pairing it with dynamic position sizing, momentum confirmation tools, and strict stop-loss rules to ensure that smooth visual patterns translate into sound risk management.
- How to Build an Investment Plan That Actually Works for You?
- What Is the MACD Indicator and How to Use It
- What Is a Wedge Pattern in Trading?
- What Is Ichimoku Cloud Strategy? A Complete Trading System
- Mastering Elliott Wave Theory: Rules and Trading Strategies
- News Trading: Strategies, Execution Risks, and Risk Control
- What Is an Iron Condor Options Strategy?
- Backtesting Explained: What It Is and Why It Really Matters
- Grid Trading: Mechanics, Parameters, and Risk Strategies
- What Is Breakout Trading and How Does It Work?
- Mean Reversion: Technical Strategies and Risk Frameworks
- Momentum Trading: Indicators, Strategies, and Risk Control
- Hammer Candlestick: Structure, Meaning, and Strategy
- Doji Candlestick: Types, Signals, and Trading Strategies
- What Is the Sharpe Ratio and How to Calculate It
- What Is VWAP and How Do Traders Use It?
- Trade the Ascending Triangle: A Step-by-Step Practical Guide
- What Is the Stochastic Oscillator and How to Use It
- How to Trade the Descending Triangle Pattern
- High Frequency Trading: Speed, Algorithms, and Market Impact
- What Is Volume Profile and How to Use It in Trading
- What Is a Morning Star Pattern Candlestick?
- Trade with Parabolic SAR: A Practical Analysis Guide
- Evening Star Pattern: Structure, Rules, and Risk Controls
- Kelly Criterion: Formula, Position Sizing, and Risk
- What Is the NYSE Minimum Trading Price? Rules Explained
Disclaimer: The content on this page is intended for educational and informational purposes only. It does not constitute financial, investment, tax, or legal advice, and should not be interpreted as a recommendation to buy, sell, or hold any financial instrument or asset. Trading and investing involve significant risk, including the possible loss of your entire capital. Products such as forex, CFDs, and cryptocurrencies carry additional risks due to leverage, high volatility, and limited regulatory protection in some jurisdictions. Past performance of any financial instrument does not guarantee future results. Any market views, forecasts, or opinions expressed are those of the author at the time of writing and may not reflect current market conditions. Platform features, fees, and regulatory status are subject to change — always verify information directly with the relevant provider or regulator before making any financial decision. BrokerSpecs may receive compensation from third parties featured on this site. Always conduct your own due diligence and consider seeking advice from a licensed financial professional before investing. Portions of this article were prepared with the assistance of AI tools and reviewed by our editorial team before publication.