


Related Tags
Entering a trade during high market volatility can feel like navigating a storm of noise. Minute-by-minute candlestick fluctuations often trigger emotional decisions, leaving you second-guessing whether a true breakout is happening or it's just intraday static. Point and Figure (P&F) charts strip away the noise by removing time and volume entirely, focusing exclusively on significant price movements.
How Do You Read a Point and Figure Chart?
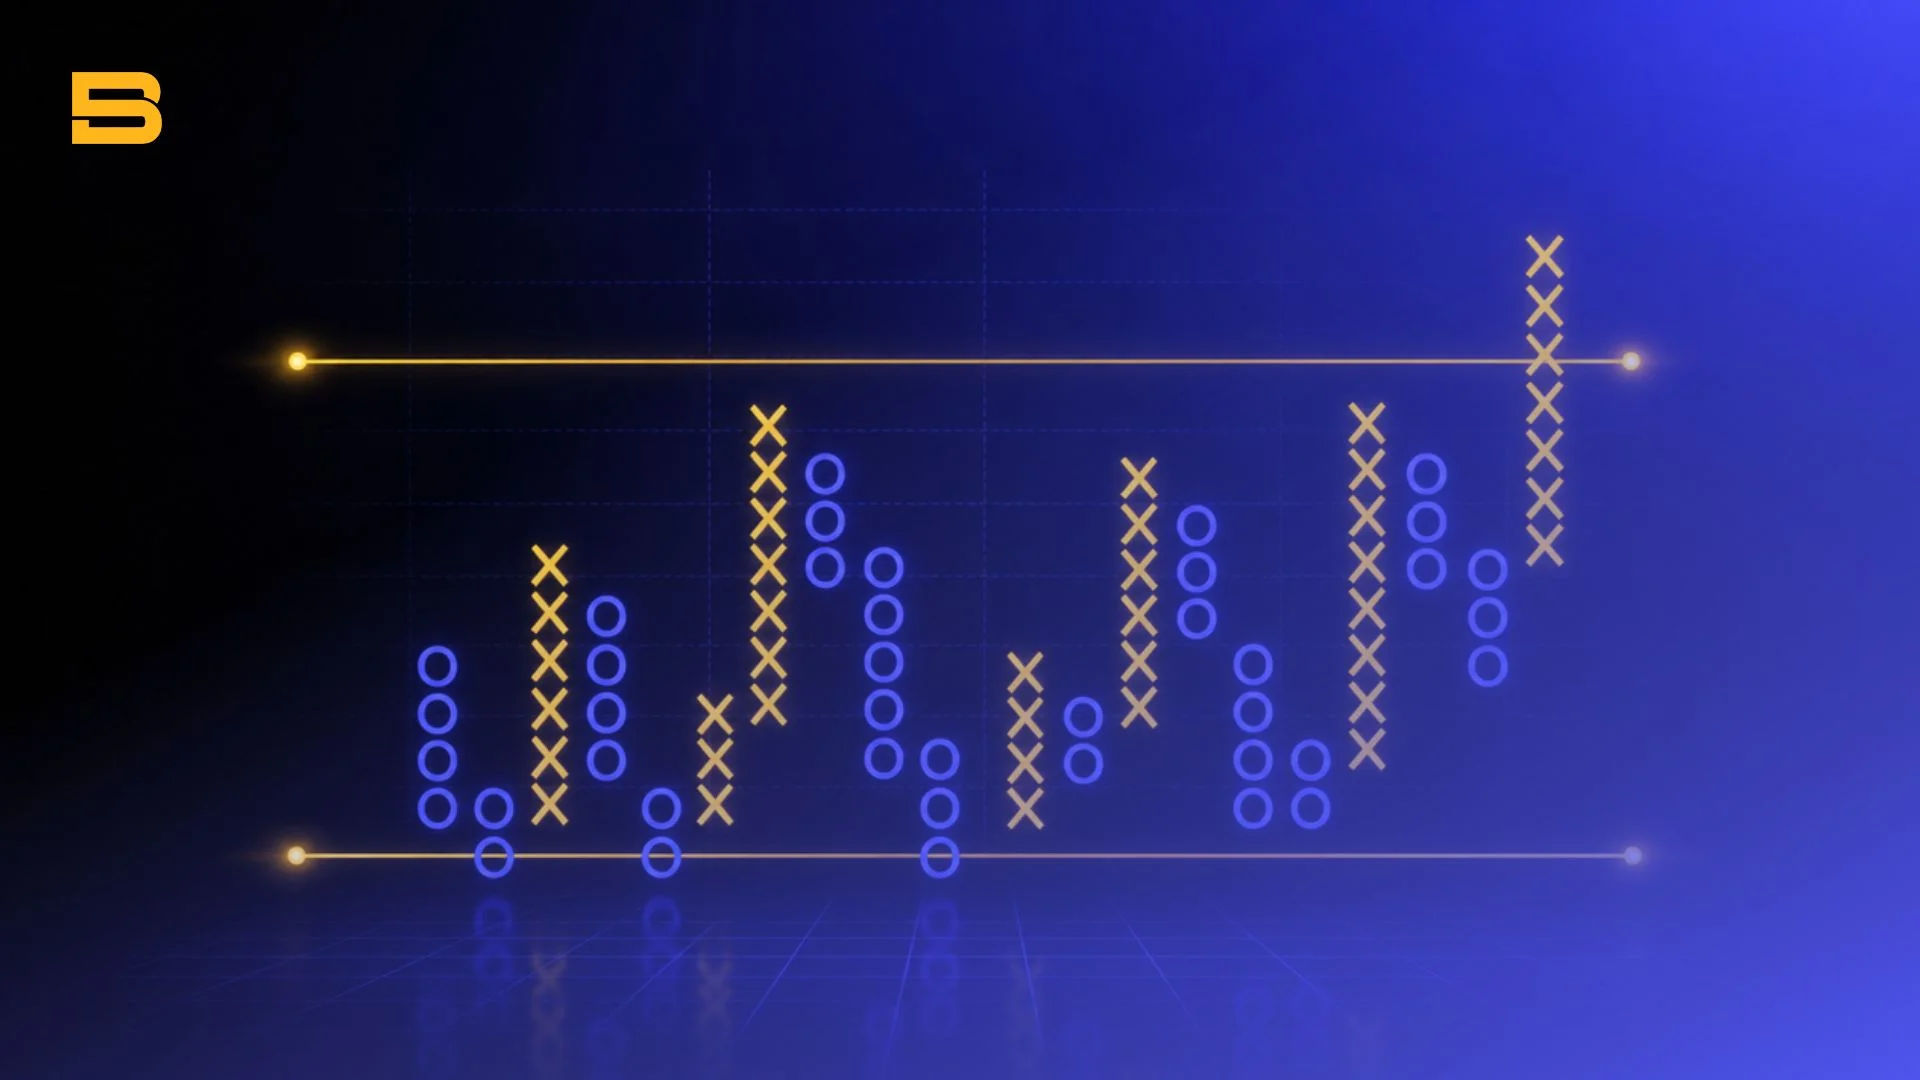
Reading a P&F chart requires a shift from time-based charting to pure price-action tracking. Instead of plotting price updates every minute, hour, or day, a P&F chart only updates when price moves by a predefined amount.
The chart consists of two primary symbols arranged in vertical columns:
- X Columns: Represent rising prices (bullish price action).
- O Columns: Represent falling prices (bearish price action).
Unlike traditional charts where the horizontal axis represents time, the horizontal axis on a P&F chart simply represents column changes (trend reversals). A single column can take ten minutes or three weeks to complete, depending on market volatility.
This fundamental design helps you isolate core supply and demand dynamics without getting distracted by sideways market drift.
Box Size and Reversal Criteria Mechanics
Two parameters govern how a P&F chart plots price: box size and reversal criteria.
- Box Size: The minimum price movement required to add a new symbol to a column. If the box size is set to $1.00, price must rise a full $1.00 to add an "X" or fall $1.00 to add an "O". Fractional movements below $1.00 are completely ignored.
- Reversal Criteria: The minimum price movement required to end the current column and start a new column in the opposite direction. The standard setting is the 3-box reversal method.
For example, if an asset is currently in an X column at $50.00 with a $1.00 box size and a 3-box reversal rule, price must drop by at least $3.00 (3 boxes × $1.00 = $3.00) down to $47.00 before a new column of O's is plotted. A minor pullback of $2.00 will not appear on the chart, maintaining your focus on the overarching trend.
Core Point and Figure Chart Patterns
Point and Figure charts excel at identifying clear horizontal support and resistance levels. Because noise is filtered, classical breakout patterns appear with sharp geometric clarity.
- Double Top Breakout: Occurs when a column of X's exceeds the high of the previous X column by at least one box. This signals that demand has overcome supply, marking a classical bullish entry signal.
- Double Bottom Breakdown: Occurs when a column of O's drops below the low of the previous O column by at least one box. This indicates supply has overwhelmed demand, signaling a bearish entry or a zone to set a stop-loss.
- Triple Top Breakout: A stronger bullish signal where price breaches two previous equal highs in X columns, which may suggest sustained buying pressure.
While breakouts on P&F charts provide clear entry signals, they do not guarantee sustained momentum. False breakouts can occur during unexpected fundamental announcements or periods of low market liquidity. No chart pattern is reliable on its own, so pair every breakout with a predefined stop-loss and a position size you can afford to lose.
How to Calculate Price Objectives on a P&F Chart
One unique advantage of Point and Figure charting is its built-in method for price objective calculation. Unlike candlestick charts where targets are often estimated manually, P&F charts utilize quantitative counting methods.
The Horizontal Count Method
The horizontal method measures the width of a consolidation base (a sideways zone where price moves back and forth before breaking out) to project the potential distance of the resulting breakout.
- Count the number of columns across the consolidation base.
- Multiply the column count by the Box Size.
- Multiply that product by the Reversal Criteria (e.g., 3).
- Add the result to the lowest point of the base (for bullish projections) or subtract it from the highest point (for bearish projections).
The Vertical Count Method
The vertical method projects a price target from the height of the first column that reverses up off a low (or down off a high, for bearish counts). You multiply that column's box count by the box size and the reversal amount, then add the result to the column's low.
Worked Target Calculation: Assume a stock falls to a low of $40.00, then reverses and builds a new column of 10 X's, breaking above prior resistance at $50.00. The chart uses a $1.00 box size and a 3-box reversal rule.
- Calculation: 10 boxes × $1.00 box size × 3 reversal factor = $30.00 projected move.
- Price Target: $40.00 column low + $30.00 = $70.00 price objective. This $70.00 figure is a hypothetical projection for illustration only. Actual prices may never reach it, and a reversal can happen at any point.
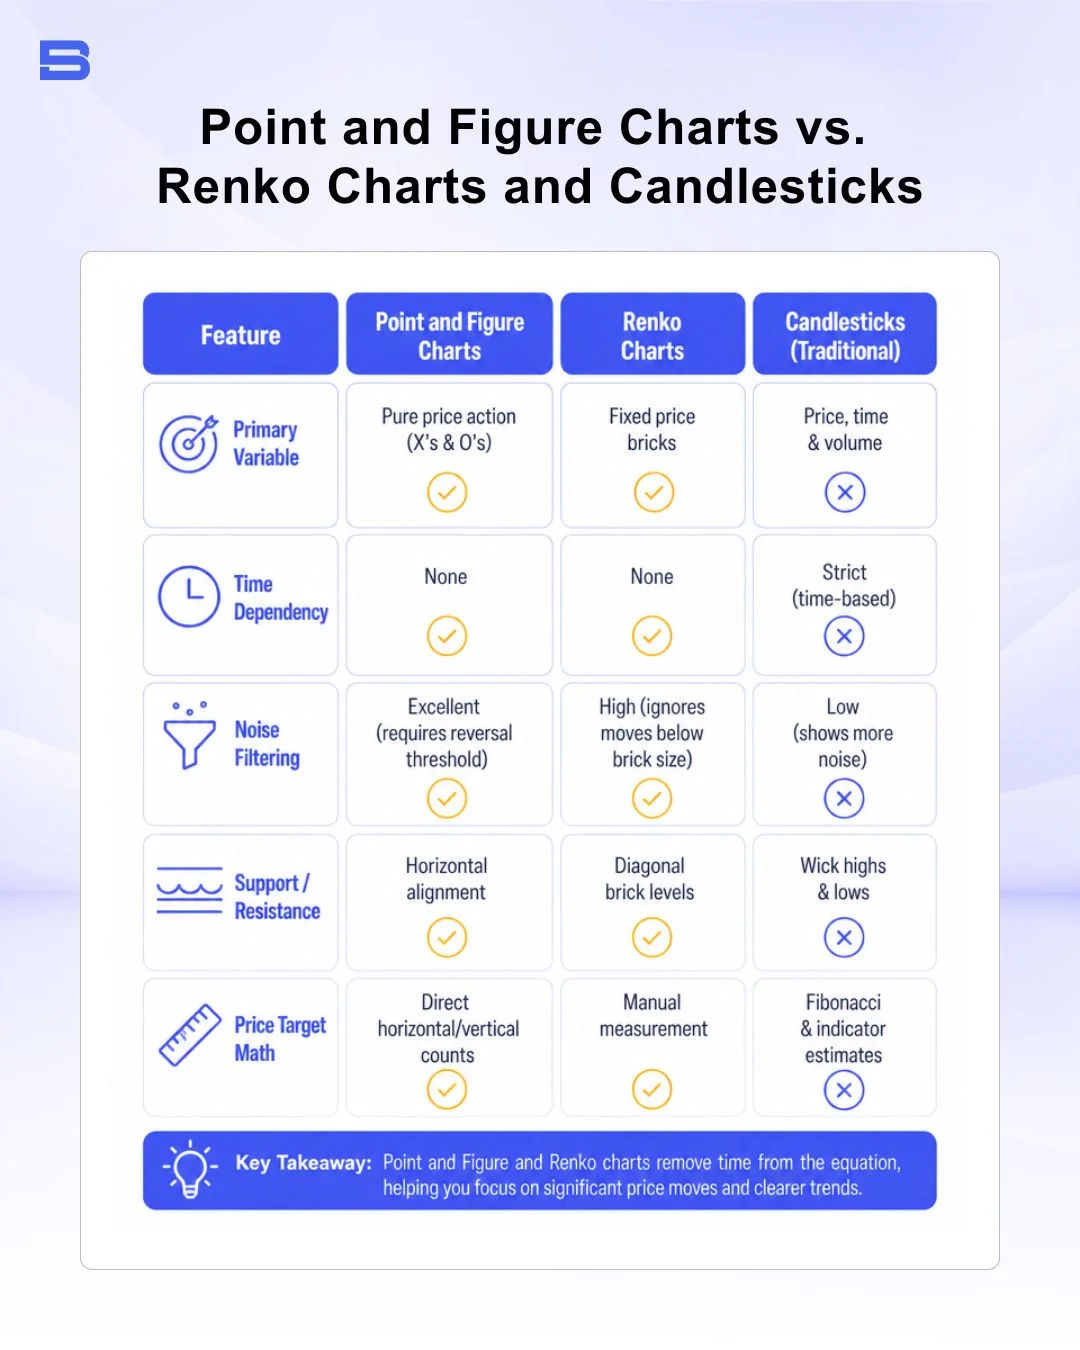
Point and Figure Charts vs Renko, Heikin Ashi, and Candlestick Charts
Understanding how P&F charts compare to other non-time or traditional charting styles helps you select the right tool for your execution style. For instance, a Renko chart focuses purely on fixed brick movements, whereas a Heikin Ashi chart uses averaged candlestick values to smooth trends.
Combining P&F Charts with Trend Indicators
While P&F charts eliminate market noise, combining them with secondary technical tools can confirm overall market context.
- Moving Averages: Applying a moving average across P&F columns helps establish macro trend direction, ensuring you only trade double top breakouts aligned with the primary trend.
- Overlaying Frameworks: Technical frameworks such as Ichimoku Cloud, Elliott Wave Theory, or Bollinger Bands provide secondary confirmation for key structural turning points.
Because P&F charts omit time, traditional volume indicators can be harder to integrate. Combining P&F price levels with liquidity measures, such as trading volume on a standard chart, helps filter out false breakouts before entering a trade.
Is a Point and Figure Chart Right for Your Trading?
Point and Figure charts offer a disciplined framework for analyzing pure price action without the clutter of time-based noise. By mastering box sizes, 3-box reversal rules, and quantitative price targets, you can evaluate market structure with analytical clarity. Always balance pure price breakouts with sound position sizing and predefined stop-loss levels to protect your capital against volatile market conditions.
- How to Build an Investment Plan That Actually Works for You?
- What Is the MACD Indicator and How to Use It
- What Is a Wedge Pattern in Trading?
- What Is Ichimoku Cloud Strategy? A Complete Trading System
- Mastering Elliott Wave Theory: Rules and Trading Strategies
- News Trading: Strategies, Execution Risks, and Risk Control
- What Is an Iron Condor Options Strategy?
- Backtesting Explained: What It Is and Why It Really Matters
- Grid Trading: Mechanics, Parameters, and Risk Strategies
- What Is Breakout Trading and How Does It Work?
- Mean Reversion: Technical Strategies and Risk Frameworks
- Momentum Trading: Indicators, Strategies, and Risk Control
- Hammer Candlestick: Structure, Meaning, and Strategy
- Doji Candlestick: Types, Signals, and Trading Strategies
- What Is the Sharpe Ratio and How to Calculate It
- What Is VWAP and How Do Traders Use It?
- Trade the Ascending Triangle: A Step-by-Step Practical Guide
- What Is the Stochastic Oscillator and How to Use It
- How to Trade the Descending Triangle Pattern
- High Frequency Trading: Speed, Algorithms, and Market Impact
- What Is Volume Profile and How to Use It in Trading
- What Is a Morning Star Pattern Candlestick?
- Trade with Parabolic SAR: A Practical Analysis Guide
- Evening Star Pattern: Structure, Rules, and Risk Controls
- Kelly Criterion: Formula, Position Sizing, and Risk
- What Is the NYSE Minimum Trading Price? Rules Explained
Disclaimer: The content on this page is intended for educational and informational purposes only. It does not constitute financial, investment, tax, or legal advice, and should not be interpreted as a recommendation to buy, sell, or hold any financial instrument or asset. Trading and investing involve significant risk, including the possible loss of your entire capital. Products such as forex, CFDs, and cryptocurrencies carry additional risks due to leverage, high volatility, and limited regulatory protection in some jurisdictions. Past performance of any financial instrument does not guarantee future results. Any market views, forecasts, or opinions expressed are those of the author at the time of writing and may not reflect current market conditions. Platform features, fees, and regulatory status are subject to change — always verify information directly with the relevant provider or regulator before making any financial decision. BrokerSpecs may receive compensation from third parties featured on this site. Always conduct your own due diligence and consider seeking advice from a licensed financial professional before investing. Portions of this article were prepared with the assistance of AI tools and reviewed by our editorial team before publication.