



Related Tags
Imagine sitting at your trading desk watching a 15-minute Euro and US Dollar (EUR/USD) chart. Moving averages are crossing back and forth, the RSI (Relative Strength Index) indicator is flashing conflicting signals, and price appears to be moving in complete chaos. You enter a buy order expecting a bounce, only for price to instantly break downward and hit your stop loss.
This frustrating scenario happens when traders rely on lagging indicators rather than reading raw price direction. By understanding market structure trading, you can strip away confusing screen clutter and analyze high-probability price action directly.
What Is Market Structure in Trading?
This price-structure framework is the sequential arrangement of swing highs and swing lows across a chart that reveals directional market bias and price trajectory.
Before analyzing price action, it is essential to distinguish market structure in trading from market structure in economics. Economic market structure refers to market competitiveness, such as monopolies, oligopolies, or perfect competition. In technical analysis, market structure refers strictly to the visual footprint left by buying and selling pressure across different timeframes.
Institutional market participants do not place orders based on simple indicator crossovers. Instead, they navigate structural price swings, seeking areas where accumulated liquidity allows large orders to be filled efficiently.
According to standards emphasized by the CFA Institute, evaluating structural price patterns provides a systematic foundation for technical decision-making rather than relying on emotional guesswork.
Core Mechanics: Swing Highs, Swing Lows, and Structural Swings
To read market structure trading accurately, you must first identify valid structural price points. A chart consists of continuous price waves that form peaks and troughs.
A standard swing high forms when a price peak is higher than the candle highs immediately to its left and right (such as a classic 3-candle or 5-candle pattern). Conversely, a swing low forms when a price trough is lower than the candle lows on either side.
- Higher High (HH): A peak that closes higher than the previous peak.
- Higher Low (HL): A trough that stays above the previous trough.
- Lower High (LH): A peak that fails to reach the previous peak.
- Lower Low (LL): A trough that drops below the previous trough.
Tracking these four structural points allows you to determine market bias without secondary technical tools.
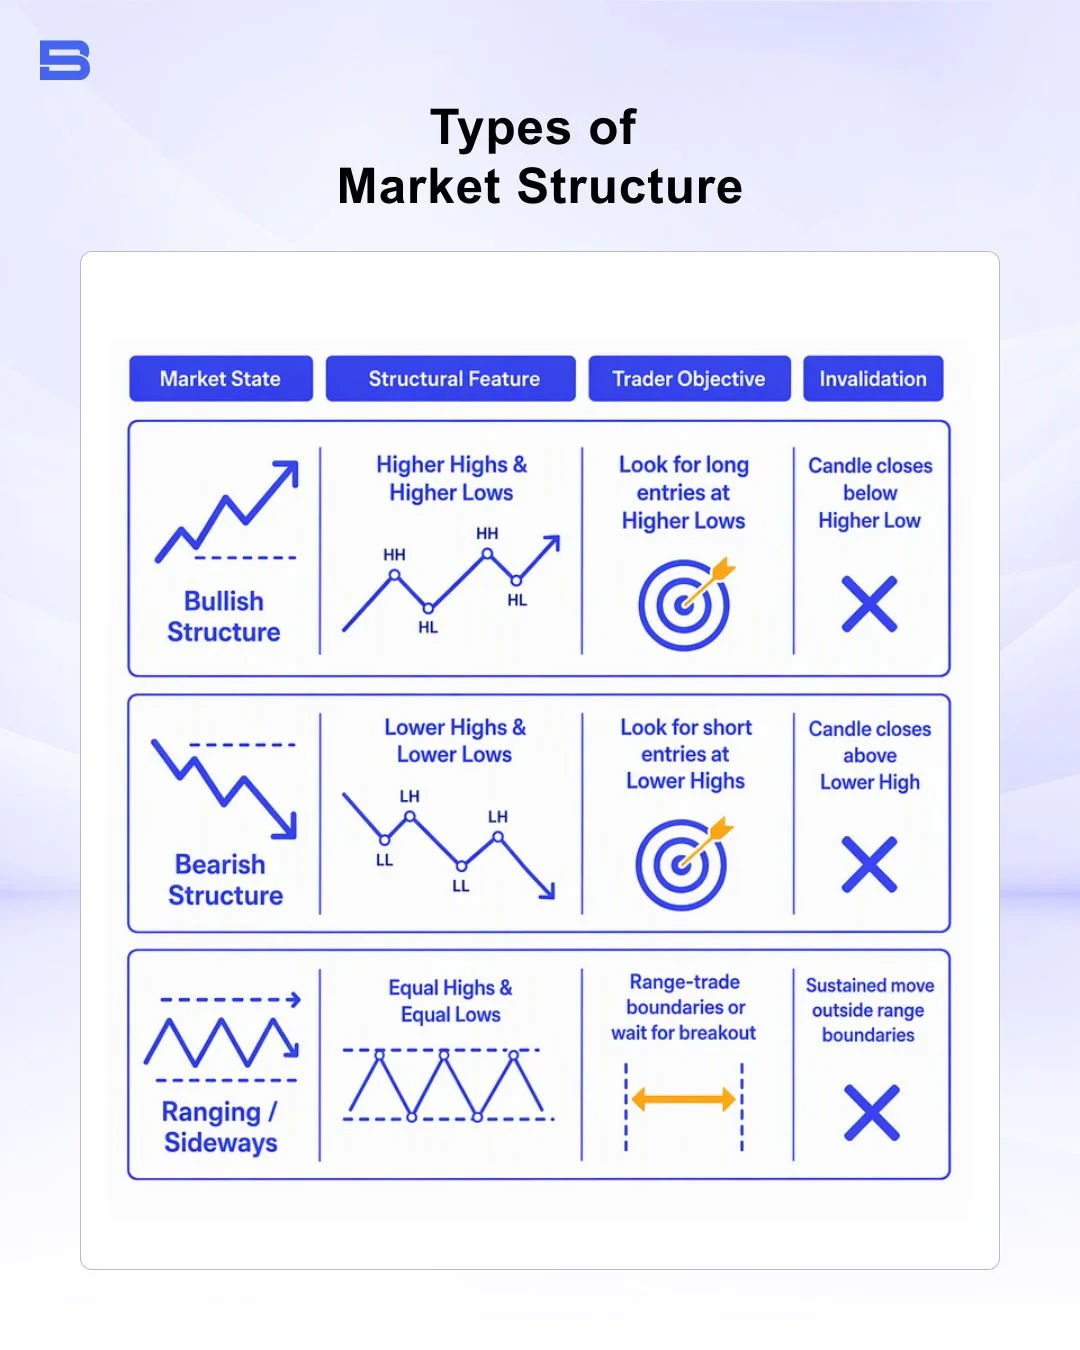
The Three Types of Market Structure
Price action moves within three distinct structural phases across all liquid financial markets.
- Bullish Market Structure: Characterized by a continuous series of Higher Highs (HH) and Higher Lows (HL). Buyers remain in control as long as previous Higher Lows hold intact.
- Bearish Market Structure: Defined by a continuous series of Lower Highs (LH) and Lower Lows (LL). Sellers dominate price action as long as Lower Highs are defended.
- Sideways / Ranging Structure: Occurs when price consolidates between established high and low boundaries without generating sustained structural expansion.
Core Signals: Break of Structure vs. Change of Character
Understanding how trend continuity transitions into trend reversal is critical when applying smart money concept frameworks.
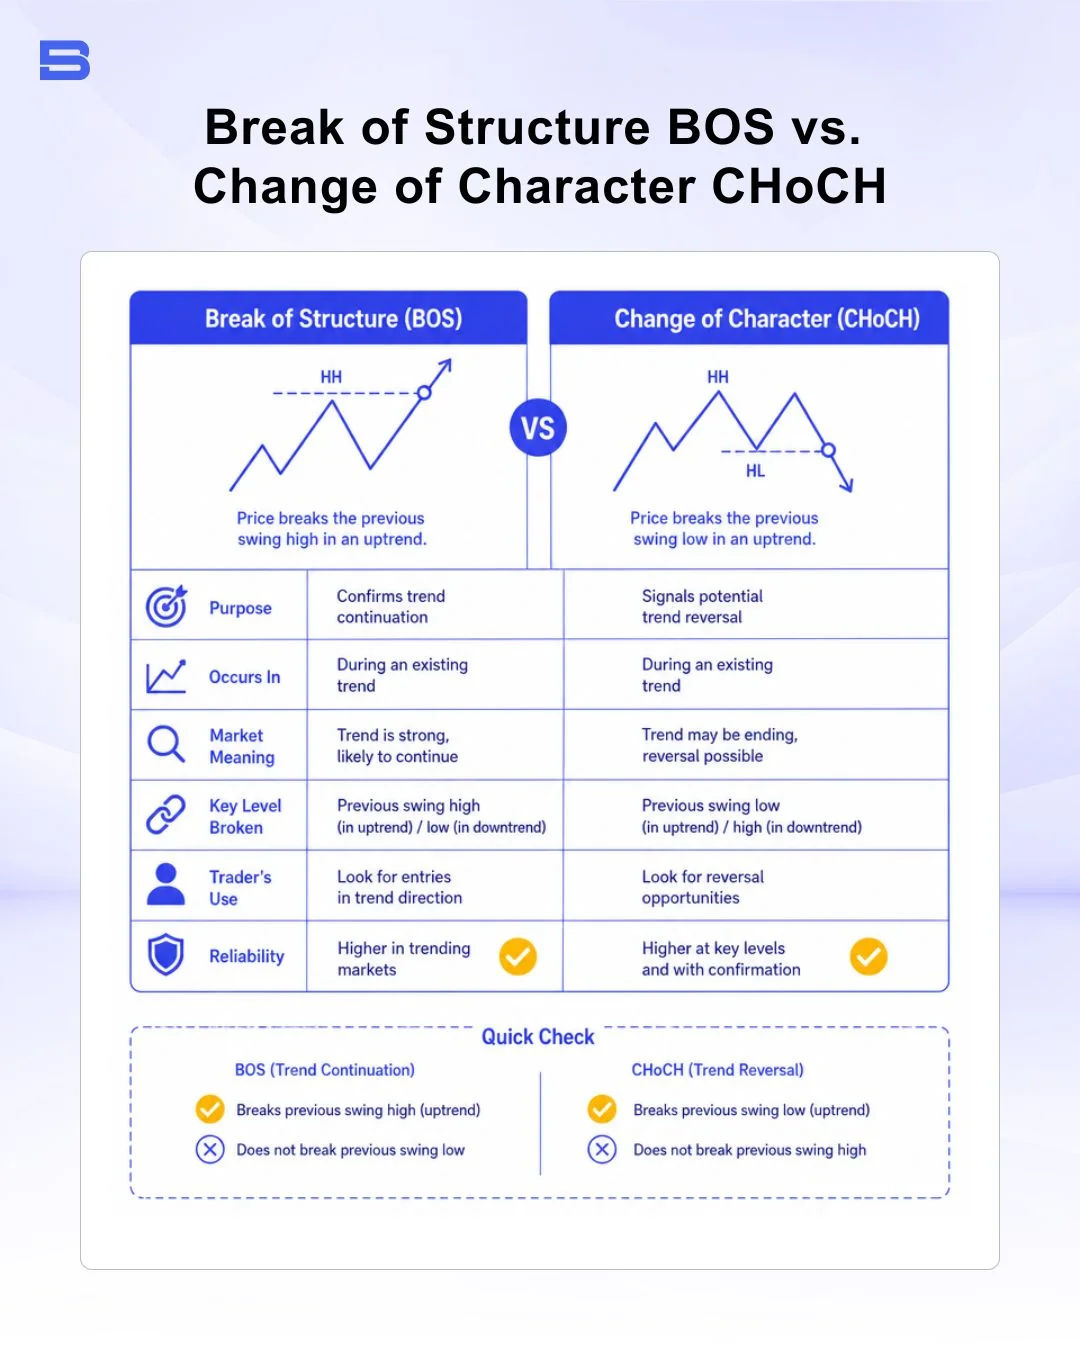
Break of Structure (BOS) vs. Change of Character (CHoCH)
A break of structure occurs when price breaks past an established structural level in the direction of the existing trend. In a bullish market, a new candle closing above the previous Higher High confirms a bullish BOS, signaling trend continuation.
A Change of Character (CHoCH) represents an early structural warning of trend reversal. In an uptrend, a CHoCH occurs when price breaks below the most recent Higher Low. This indicates that aggressive sellers have breached structural support, shifting the immediate bias from bullish to bearish.
Smart money concepts emphasize watching how price breaks these key points. A single wick piercing past a swing level often signals a temporary liquidity grab, where market makers sweep stop orders before resuming direction. To confirm a genuine structural break, traders typically look for a full candle body close beyond the swing point.
Top-Down Multi-Timeframe Structure Analysis
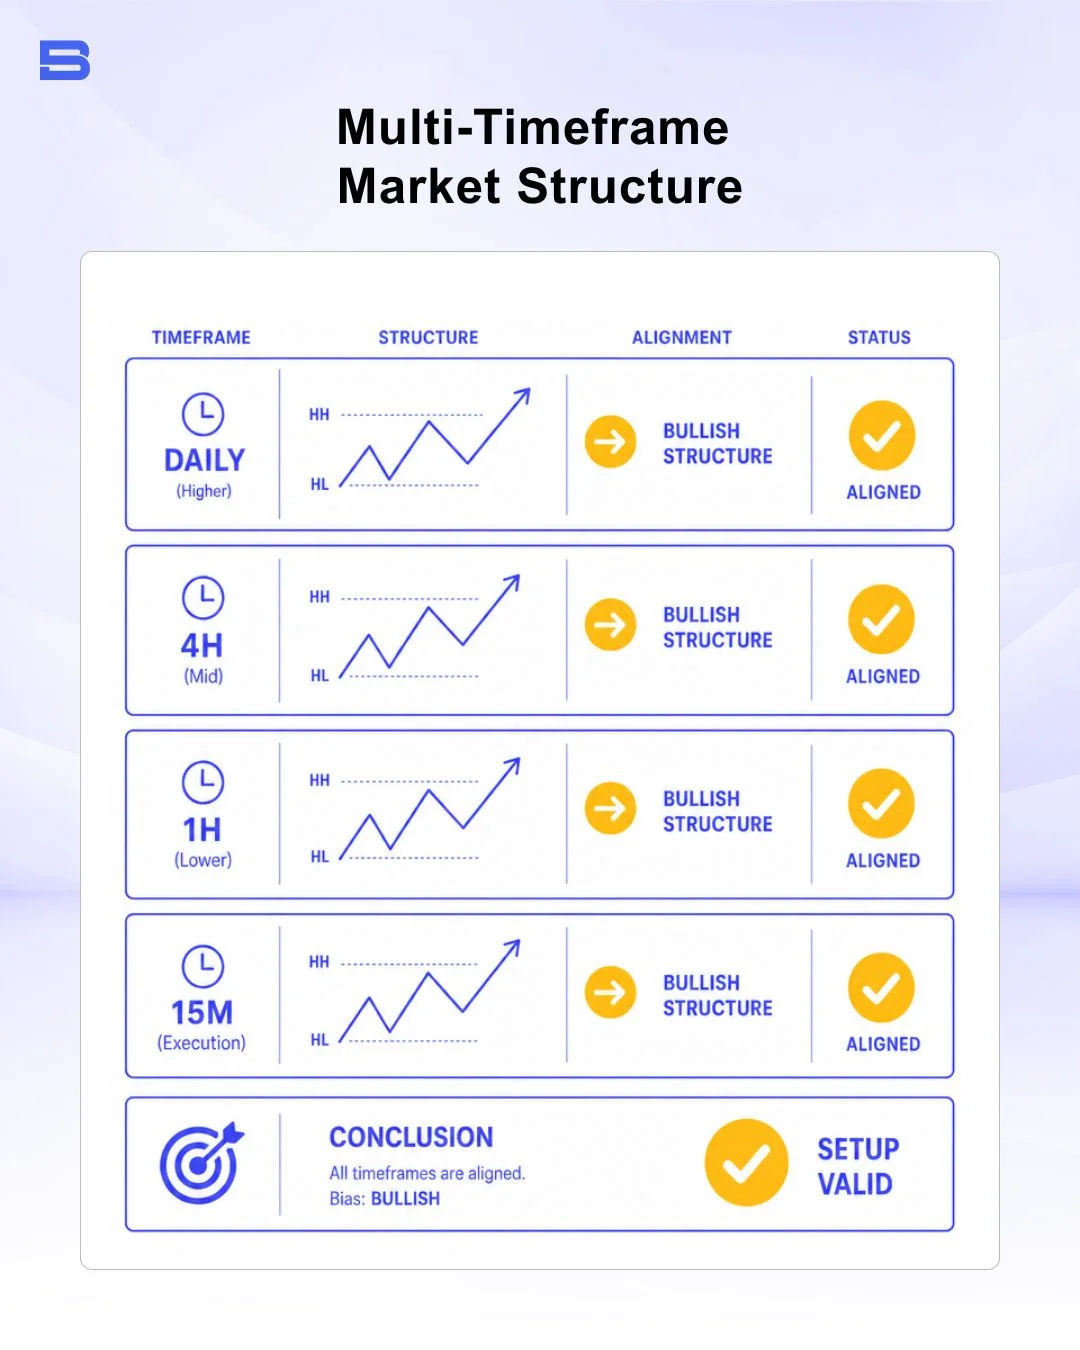
Markets are fractal, meaning smaller timeframes develop structural swings inside higher timeframe trends. Trading lower timeframe setups against higher timeframe trends is a common mistake that leads to unnecessary losses.
A structured top-down approach helps align execution with institutional flow:
- Higher Timeframe (Daily / 4-Hour): Establishes dominant market bias (bullish or bearish).
- Lower Timeframe (15-Minute / 5-Minute): Identifies precise structural entries such as a fair value gap (a pricing imbalance left by a fast move) or an order block (the last opposing candle before a strong impulse).
Worked Multi-Timeframe Scenario
Suppose the 4-Hour EUR/USD chart is structurally bullish, steadily making Higher Highs and Higher Lows. Price begins pulling back toward a 4-Hour bullish structural support zone.
Zooming into the 15-Minute chart, price displays a temporary bearish structure of Lower Highs and Lower Lows during the pullback. Once price reaches the 4-Hour support zone, the 15-Minute chart breaks above its most recent Lower High, printing a 15-Minute CHoCH.
- Trade Entry: Enter a long position at 1.0850 upon a lower-timeframe pullback following the 15M CHoCH.
- Stop Loss: Place the stop loss at 1.0820, safely below the recent 15M structural Higher Low.
- Take Profit Target: Target the recent 4-Hour Higher High at 1.0940.
- Risk/Reward Calculation: Risking 30 pips (1.0850 - 1.0820) to gain 90 pips (1.0940 - 1.0850) yields a favorable 1:3 Risk-to-Reward ratio.
Trading with leverage amplifies both potential profits and potential losses. A 2% market move against a 30:1 leveraged position can wipe out a substantial portion of your account margin. Structural stop losses placed beyond key swing points ensure capital remains protected when market bias is invalidated.
Market Structure vs. Support and Resistance
While both concepts identify critical price zones, their execution mechanisms differ:
- Support and Resistance: Refers to static or dynamic price levels where buying or selling interest historically concentrated.
- Market Structure: Refers to the dynamic, sequential hierarchy of price swings that reveals whether buyers or sellers hold current market control.
Traditional support and resistance lines can remain on charts indefinitely. This framework adapts continuously to price movement, providing clearer context on whether a support level is likely to hold or break based on structural momentum.
Conclusion
Mastering this trading framework equips you with a logical approach to interpret price action across any financial market. By focusing on higher highs, lower lows, structural breaks, and top-down alignment, you can navigate trend changes with confidence without relying on lagging indicators.
Always implement disciplined position sizing and strict structural stop-loss management to protect capital during volatile market conditions. Educational resources monitored by regional regulatory bodies such as the Securities Commission Malaysia (SC) emphasize the importance of thorough risk management and realistic expectations when trading leveraged markets.
- How to Build an Investment Plan That Actually Works for You?
- What Is the MACD Indicator and How to Use It
- What Is a Wedge Pattern in Trading?
- What Is Ichimoku Cloud Strategy? A Complete Trading System
- Mastering Elliott Wave Theory: Rules and Trading Strategies
- News Trading: Strategies, Execution Risks, and Risk Control
- What Is an Iron Condor Options Strategy?
- Backtesting Explained: What It Is and Why It Really Matters
- Grid Trading: Mechanics, Parameters, and Risk Strategies
- What Is Breakout Trading and How Does It Work?
- Mean Reversion: Technical Strategies and Risk Frameworks
- Momentum Trading: Indicators, Strategies, and Risk Control
- Hammer Candlestick: Structure, Meaning, and Strategy
- Doji Candlestick: Types, Signals, and Trading Strategies
- What Is the Sharpe Ratio and How to Calculate It
- What Is VWAP and How Do Traders Use It?
- Trade the Ascending Triangle: A Step-by-Step Practical Guide
- What Is the Stochastic Oscillator and How to Use It
- How to Trade the Descending Triangle Pattern
- High Frequency Trading: Speed, Algorithms, and Market Impact
- What Is Volume Profile and How to Use It in Trading
- What Is a Morning Star Pattern Candlestick?
- Trade with Parabolic SAR: A Practical Analysis Guide
- Evening Star Pattern: Structure, Rules, and Risk Controls
- Kelly Criterion: Formula, Position Sizing, and Risk
- What Is the NYSE Minimum Trading Price? Rules Explained
Disclaimer: The content on this page is intended for educational and informational purposes only. It does not constitute financial, investment, tax, or legal advice, and should not be interpreted as a recommendation to buy, sell, or hold any financial instrument or asset. Trading and investing involve significant risk, including the possible loss of your entire capital. Products such as forex, CFDs, and cryptocurrencies carry additional risks due to leverage, high volatility, and limited regulatory protection in some jurisdictions. Past performance of any financial instrument does not guarantee future results. Any market views, forecasts, or opinions expressed are those of the author at the time of writing and may not reflect current market conditions. Platform features, fees, and regulatory status are subject to change — always verify information directly with the relevant provider or regulator before making any financial decision. BrokerSpecs may receive compensation from third parties featured on this site. Always conduct your own due diligence and consider seeking advice from a licensed financial professional before investing. Portions of this article were prepared with the assistance of AI tools and reviewed by our editorial team before publication.