



Related Tags
You spot a breakout setup on EUR/USD and enter a standard long position. Minutes later, GBP/USD presents an identical bullish continuation signal, prompting you to buy that as well. Instead of spreading your market risk, you wake up to find both trades stopped out simultaneously because the US Dollar posted a sudden macroeconomic rally. Building a coherent investment plan requires recognizing that currency pairs never move in isolation.
What Is Forex Pair Correlation and How Does It Work?
Forex pair correlation is the statistical measurement of how two currency pairs move in relation to each other over a defined period.
Because foreign exchange instruments trade in pairs—a base currency priced against a quote currency—no single asset moves entirely on its own. When you execute a transaction in EUR/USD, you are not simply trading European economic performance. You are simultaneously expressing a directional view on the US Dollar.
According to the latest global turnover data published by the Bank for International Settlements (BIS), the US Dollar was involved in approximately 89.2% of all foreign exchange transactions in April 2025, making it the world’s most traded currency.
Consequently, any macroeconomic event that shifts demand for the reserve currency ripples across several pairs at once. Understanding forex pair correlation dynamics prevents you from treating separate chart tickers as genuinely independent risk events.
How to Read the Currency Correlation Coefficient Matrix
To quantify the relationship between currency pairs, analysts calculate a mathematical value known as the currency correlation coefficient.
Standard portfolio analysis models, as explained by the CFA Institute, measure correlation coefficients on a numerical scale ranging from −1.00 to +1.00. A reading of +1.00 represents perfect positive correlation, meaning two currency pairs move in the same direction consistently, although their percentage movements may differ.
Conversely, a reading of −1.00 reflects perfect negative correlation, where the pairs travel in complete mirror opposition. A reading hovering near 0.00 signals that no linear statistical connection exists between the two currency pairings.
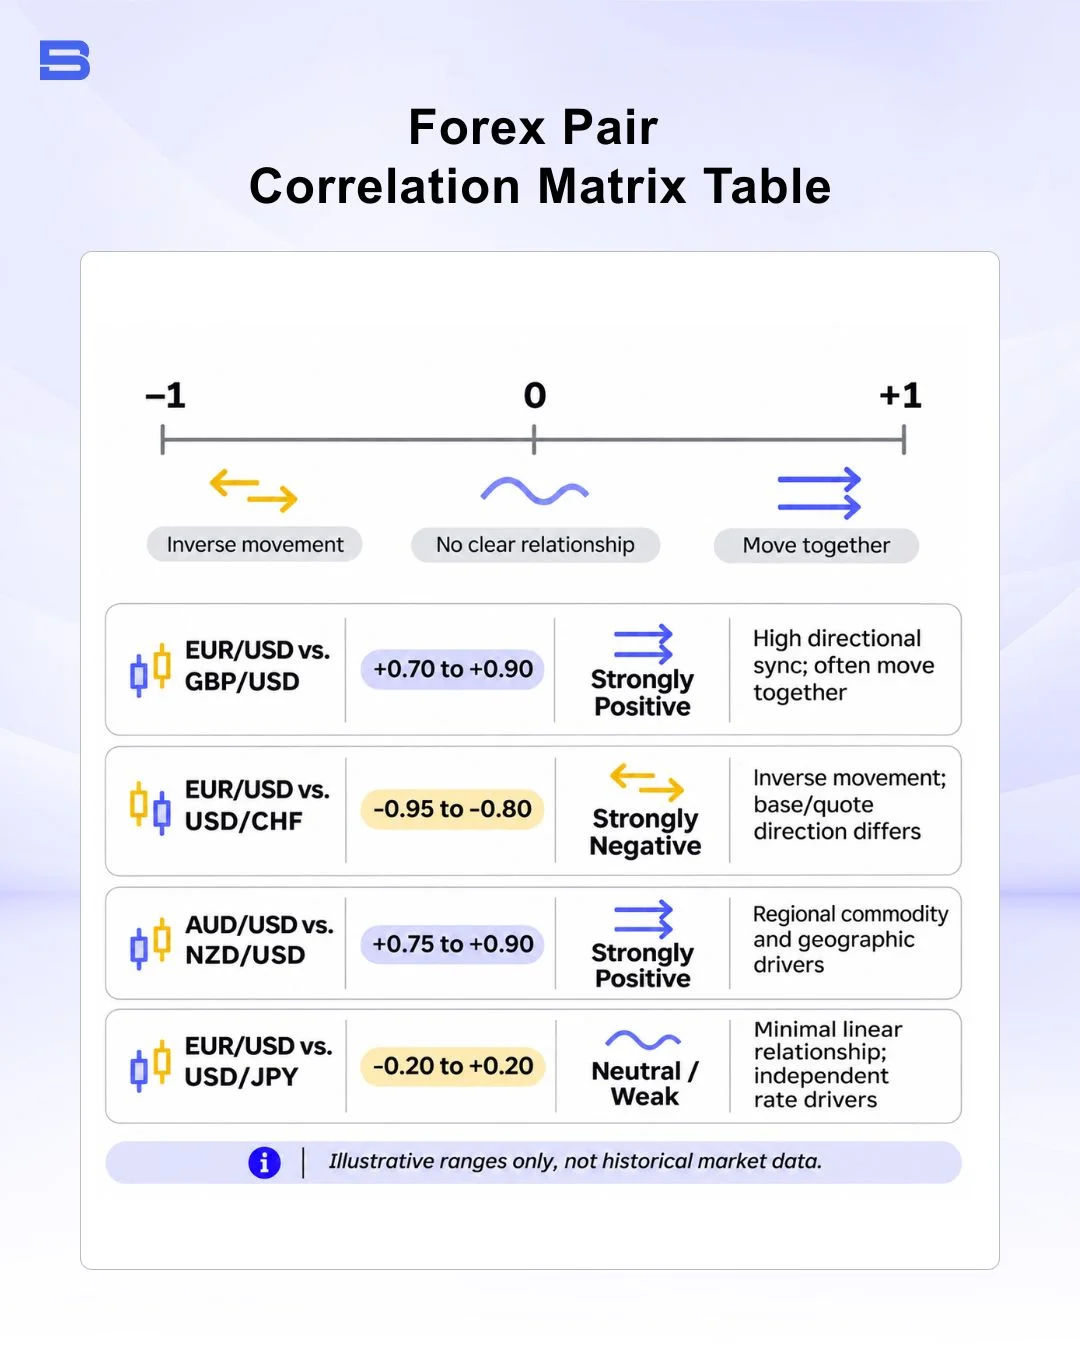
Positive Correlation vs Negative Correlation in Major Pairs
Positive correlation occurs when two distinct pairs move in identical directions due to shared economic dependencies or common quote currencies. For example, EUR/USD and GBP/USD frequently track each other because both economies share tight European trade ties and both are priced directly against the US Dollar.
Negative correlation occurs when two currency pairs move in opposite directions, often driven by currency arrangement mechanics. A classic example is EUR/USD versus USD/CHF. In the first pair, the US Dollar acts as the quote currency, while in the second, it functions as the base currency. When broad US Dollar buying occurs, EUR/USD falls while USD/CHF rises, creating an almost mechanical mirror image.
How to Trade Forex Correlation to Manage Portfolio Risk
The primary practical benefit of tracking correlation lies in defensive portfolio management rather than hunting speculative trade entries.
Traders often run into large drawdowns by confusing multi-pair trading with diversification. Suppose you establish a 1.0 standard lot long position on EUR/USD, risking $1,000 on a 100-pip stop-loss. Seeing an attractive setup on GBP/USD, you also open a 1.0 standard lot long position with another $1,000 risk allocation. Because both pairs are priced against the US Dollar, you have not diversified your portfolio at all.
Instead, you have simply established an effective 2.0-lot short position against the US Dollar. If a stronger-than-expected US inflation report hits the wires, both pairs will likely collapse together, triggering a simultaneous $2,000 loss that breaches your established position sizing limits. Understanding currency co-movement ensures you evaluate your net exposure across the entire portfolio rather than evaluating positions one ticket at a time.
Why Timeframes Matter: One-Month vs One-Year Correlation
Correlation is a dynamic calculation that changes based on your observation window. A rolling one-month correlation matrix captures short-term market noise, liquidity imbalances, and reaction to breaking economic prints. In contrast, a one-year rolling correlation reflects fundamental macroeconomic alignment, such as benchmark interest rate differentials set by central banks.
Traders who rely solely on annual figures may miss rapid short-term divergences. Always align your correlation lookback window with your intended trade holding horizon.
The Hidden Risk: Why Forex Pair Correlations Shift and Break Down
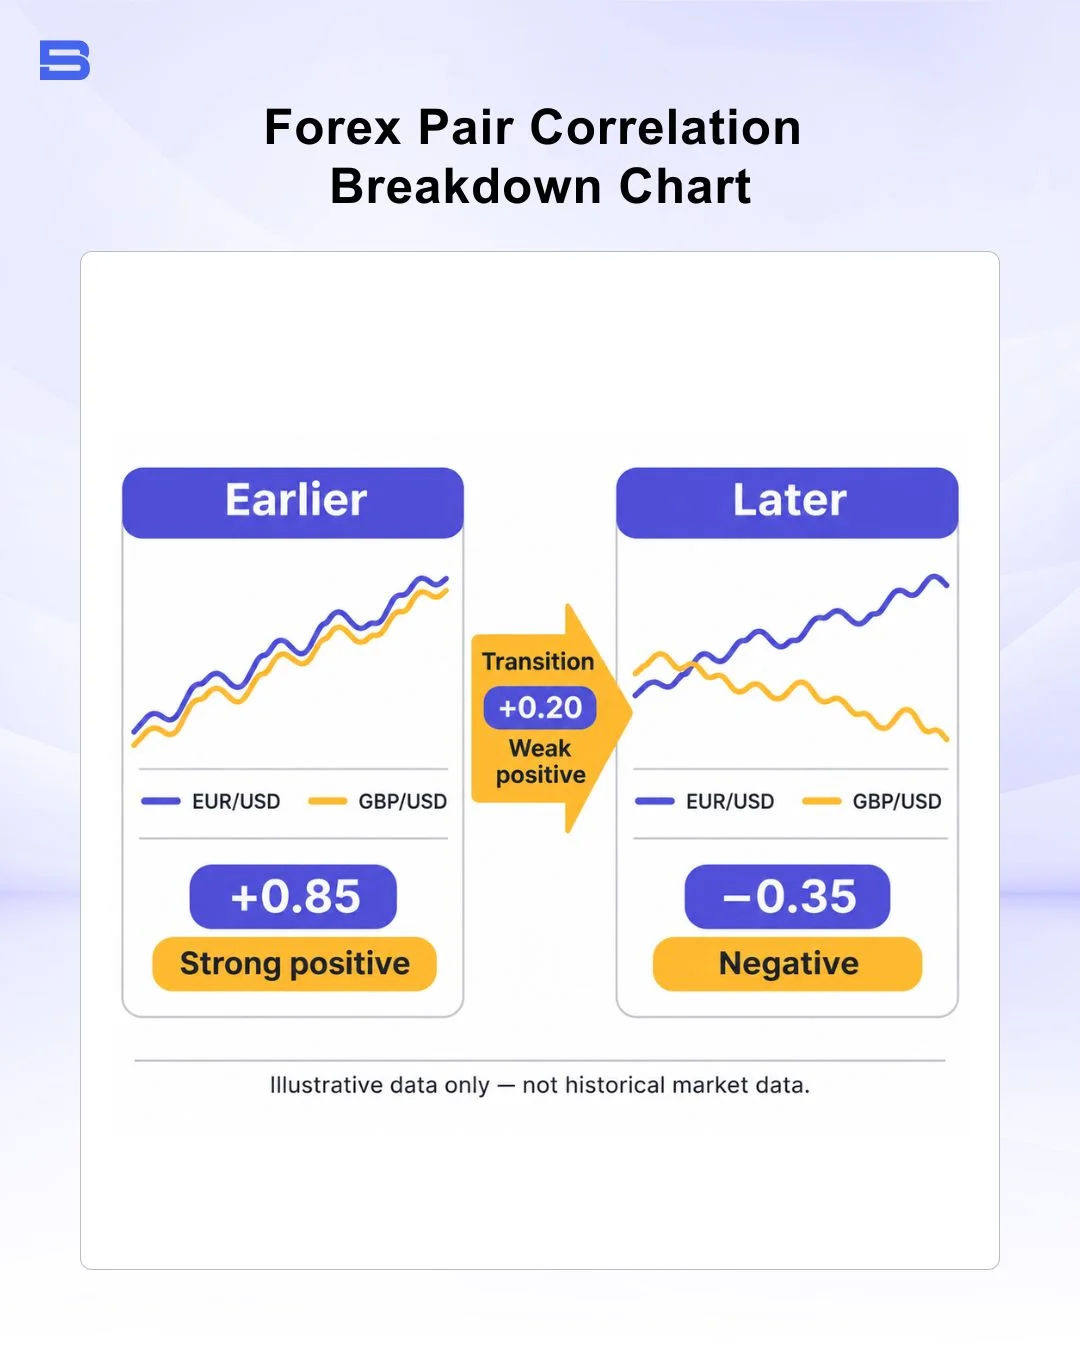
A common trap in quantitative trading is assuming that currency relationships remain permanent.
A phenomenon known as correlation breakdown occurs when monetary policy divergences or unexpected geopolitical developments disrupt historically established relationships between financial assets. For example, when the European Central Bank (ECB) adjusts its benchmark deposit facility rate independently of the Federal Reserve or Bank of England, changing interest rate differentials can influence currency valuations and weaken previously observed correlations between currency pairs.
For instance, an asymmetric energy supply disruption affecting the Eurozone can cause EUR/USD to plummet while commodity-exporting currencies rally, destroying expected co-movements within days.
Never use correlation analysis as an alternative to an individual stop-loss order on every open trade ticket. While statistical alignments give you an edge in exposure monitoring, sudden regime shifts will quickly erase capital if structural stops are abandoned.
Intermarket Analysis: Connecting Currencies to Commodities and Yields
Currencies do not operate in a closed system; their valuations link directly to global debt and raw materials. Incorporating broad intermarket analysis provides essential context for why currency correlations exist in the first place.
Commodity-driven currencies, commonly called "commodity currencies," exhibit strong positive correlations with the natural resources their domestic economies export. The Australian Dollar (AUD/USD) historically tracks industrial copper and gold pricing, while the Canadian Dollar (USD/CAD) exhibits an inverse correlation with West Texas Intermediate (WTI) crude oil prices because oil exports fuel Canadian fiscal health.
Sovereign government bond yield spreads between nations can also influence cross-border capital flows. When two-year US Treasury yields widen their premium over German Bund yields, capital may flow toward US Dollar assets, which can shift correlations across many dollar pairs at once.
Statistical Arbitrage and Mean-Reversion Pairs
Algorithmic funds often leverage correlation tables through quantitative strategies like statistical arbitrage. When two historically linked pairs diverge beyond two standard deviations from their historical mean spread, quantitative models establish a mean-reversion trade, buying the lagging pair and shorting the outperforming pair.
However, retail traders should exercise caution when applying spread-arbitrage strategies based on forex pair correlation. If a divergence reflects a permanent structural economic shift rather than a temporary liquidity imbalance, the spread may continue widening, exposing mean-reversion strategies to prolonged losses and severe drawdowns.
The Bottom Line on Forex Pair Correlation
Understanding forex pair correlation helps you manage overall market exposure and avoid unintentionally doubling your risk across positions influenced by the same macroeconomic factors. Use correlation coefficients as an evolving risk assessment tool rather than automatic trading signals, and maintain disciplined risk limits across all open positions.
- How to Build an Investment Plan That Actually Works for You?
- What Is the MACD Indicator and How to Use It
- What Is a Wedge Pattern in Trading?
- What Is Ichimoku Cloud Strategy? A Complete Trading System
- Mastering Elliott Wave Theory: Rules and Trading Strategies
- News Trading: Strategies, Execution Risks, and Risk Control
- What Is an Iron Condor Options Strategy?
- Backtesting Explained: What It Is and Why It Really Matters
- Grid Trading: Mechanics, Parameters, and Risk Strategies
- What Is Breakout Trading and How Does It Work?
- Mean Reversion: Technical Strategies and Risk Frameworks
- Momentum Trading: Indicators, Strategies, and Risk Control
- Hammer Candlestick: Structure, Meaning, and Strategy
- Doji Candlestick: Types, Signals, and Trading Strategies
- What Is the Sharpe Ratio and How to Calculate It
- What Is VWAP and How Do Traders Use It?
- Trade the Ascending Triangle: A Step-by-Step Practical Guide
- What Is the Stochastic Oscillator and How to Use It
- How to Trade the Descending Triangle Pattern
- High Frequency Trading: Speed, Algorithms, and Market Impact
- What Is Volume Profile and How to Use It in Trading
- What Is a Morning Star Pattern Candlestick?
- Trade with Parabolic SAR: A Practical Analysis Guide
- Evening Star Pattern: Structure, Rules, and Risk Controls
- Kelly Criterion: Formula, Position Sizing, and Risk
- What Is the NYSE Minimum Trading Price? Rules Explained
Disclaimer: The content on this page is intended for educational and informational purposes only. It does not constitute financial, investment, tax, or legal advice, and should not be interpreted as a recommendation to buy, sell, or hold any financial instrument or asset. Trading and investing involve significant risk, including the possible loss of your entire capital. Products such as forex, CFDs, and cryptocurrencies carry additional risks due to leverage, high volatility, and limited regulatory protection in some jurisdictions. Past performance of any financial instrument does not guarantee future results. Any market views, forecasts, or opinions expressed are those of the author at the time of writing and may not reflect current market conditions. Platform features, fees, and regulatory status are subject to change — always verify information directly with the relevant provider or regulator before making any financial decision. BrokerSpecs may receive compensation from third parties featured on this site. Always conduct your own due diligence and consider seeking advice from a licensed financial professional before investing. Portions of this article were prepared with the assistance of AI tools and reviewed by our editorial team before publication.