



Related Tags
You are watching a currency pair break decisively past a major multi-week resistance level. Breakout buyers rush into the market, driving volume higher, only for the price to suddenly stall, form a rejection wick, and violently reverse back into the prior range.
What appears to standard breakout traders as an unexpected trap is often a textbook harmonic extension playing out with mathematical precision. Mastering butterfly pattern trading allows you to identify these terminal exhaustion zones where extreme market momentum reaches structural exhaustion and turns.
What Is the Butterfly Pattern in Trading? (Structure vs. Options Spread)
Butterfly pattern trading centers on an advanced five-point geometric reversal chart pattern that uses precise Fibonacci ratios to identify exhaustion zones where a trend is likely to reverse. First discovered by Bryce Gilmore and later refined by Larry Pesavento, this setup belongs to the broader family of harmonic patterns.
Before analyzing its structural geometry, it is crucial to clarify a common misconception among technical analysts. Butterfly pattern trading on a price chart is entirely distinct from an options butterfly spread, which is a multi-leg derivative strategy designed for neutral volatility.
Instead, the butterfly pattern trading is a pure price-action formation built from consecutive price swings labeled X, A, B, C, and D. It builds directly upon simpler geometric structures like the ABCD pattern, but incorporates an aggressive extension that pushes price beyond the initial starting swing.
What Is the Butterfly Harmonic Pattern and How Does It Form?
Butterfly pattern trading relies on an XABCD structure composed of four distinct price legs. Its visual signature is characterized by Point D extending beyond the original starting swing at Point X, creating an extended geometric "wing" that tests trader psychology.
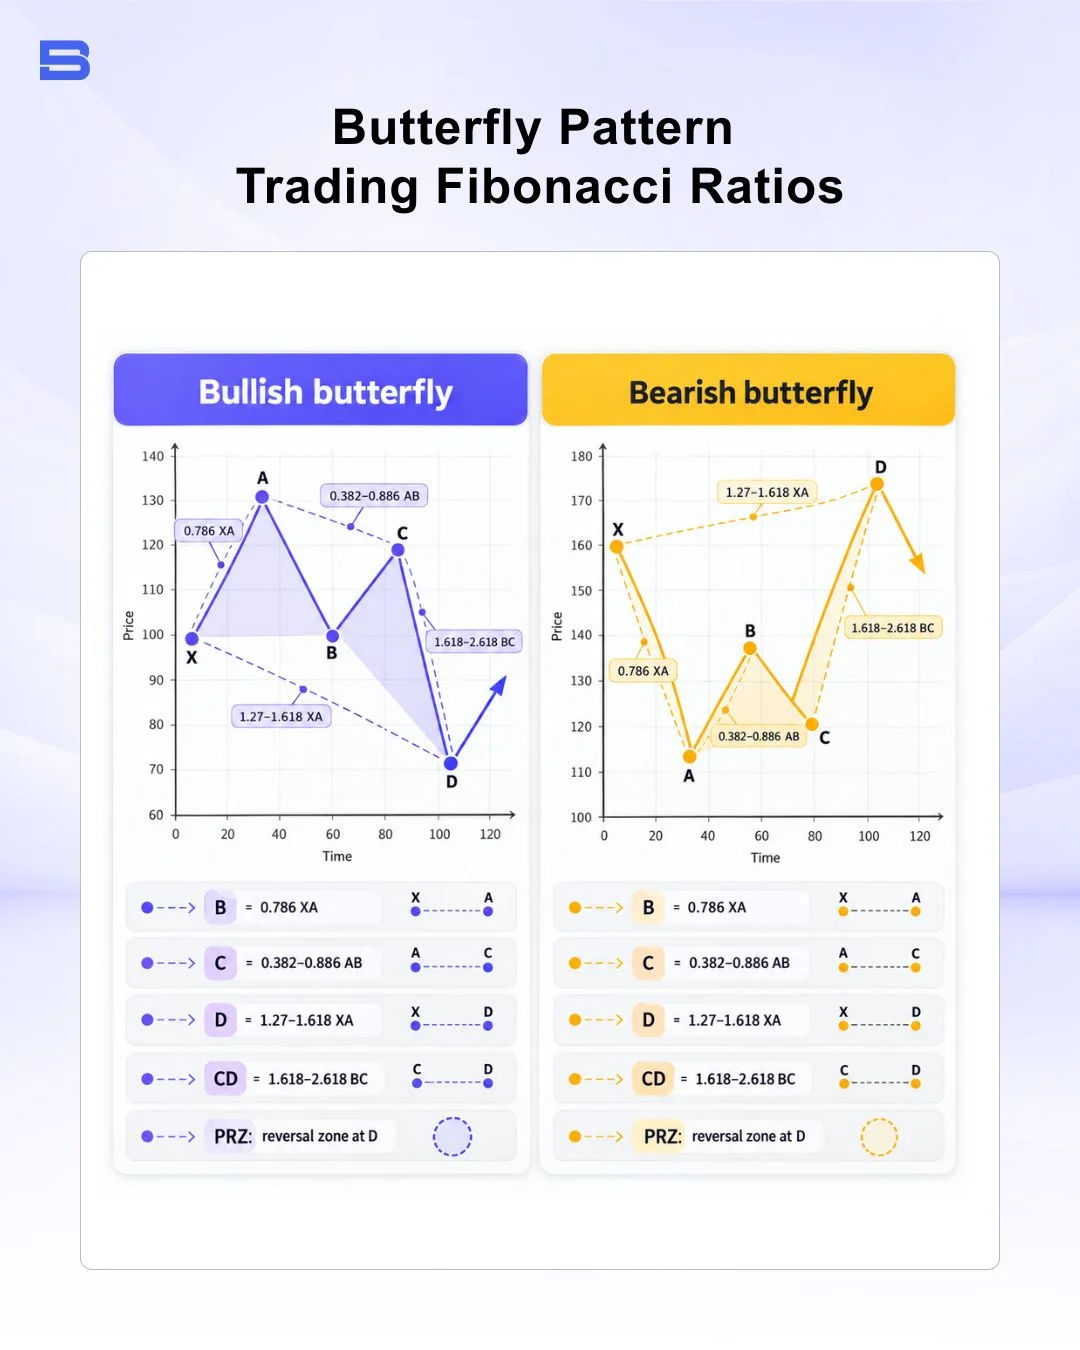
To validate this pattern, the price swings must conform closely to precise Fibonacci retracement and extension thresholds:
- XA Leg: The foundational impulse wave that establishes the overarching structural range.
- AB Leg: A mandatory counter-trend retracement that must terminate sharply at the 78.6% Fibonacci retracement of the XA swing.
- BC Leg: A secondary counter-move that retraces between 38.2% and 88.6% of the AB leg, staying strictly within the boundaries of A and B.
- CD Leg: The extended terminal leg that projects 161.8% to 261.8% of the BC swing, simultaneously extending to the 127.2% or 161.8% Fibonacci extension of the initial XA leg.
Among these geometric parameters, the 78.6% retracement at Point B serves as the non-negotiable structural anchor. If the market retraces to only 61.8% at Point B, the formation aligns with a different technical setup altogether, requiring adjustments similar to tracking a three-drive pattern.
Butterfly Pattern vs. Gartley Pattern: Key Differences
Traders frequently confuse butterfly pattern trading with the Gartley pattern because both share an XABCD five-point framework. However, their structural behavior at Point B and final completion point at Point D represent opposing market dynamics.
A Gartley is an internal retracement pattern where Point D completes inside the initial impulse range, strictly at the 78.6% retracement of XA. In contrast, the Butterfly is an external extension pattern where Point D breaches the origin level at Point X, reaching between 127.2% and 161.8% of XA before seeking a reversal.
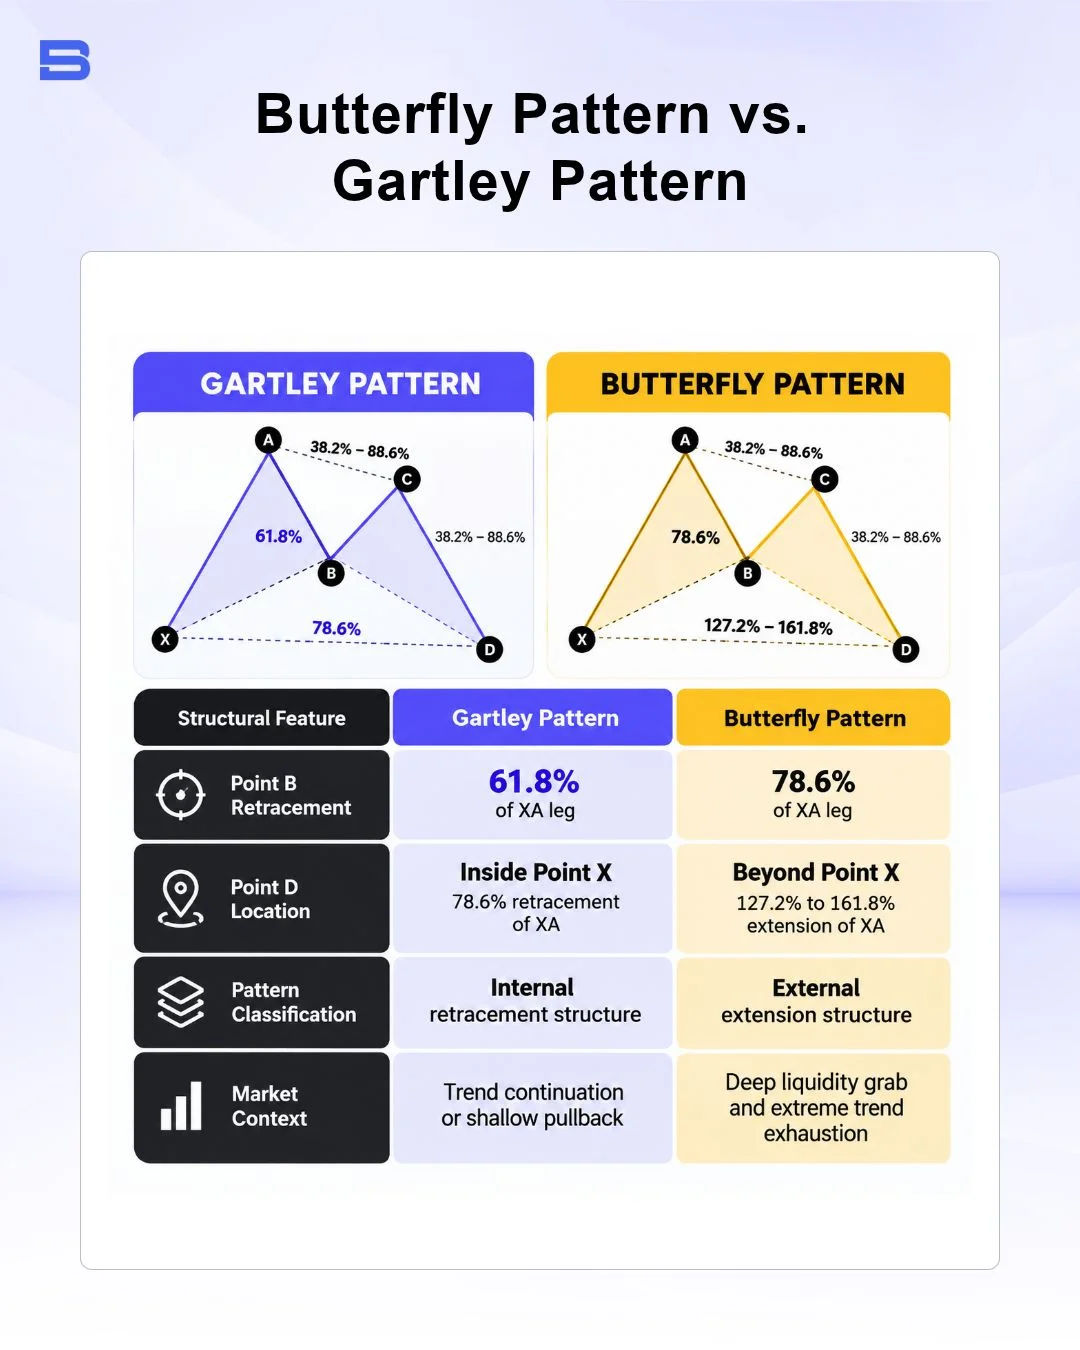
Because Point D in a Butterfly extends past Point X, it triggers protective stop orders from early participants who assumed Point X was impenetrable. This dynamic generates temporary liquidity, often exhausting the prevailing trend right as the harmonic structure completes.
Bullish vs. Bearish Butterfly Patterns: Spotting the Reversal
A Bullish Butterfly forms an "M" shape on your charting software, signaling potential upward reversals. The price plunges sharply from Point C, slicing below Point X into new swing lows, where retail participants frequently open emotional short positions. Once Point D touches the 127.2% or 161.8% extension of XA, selling momentum often dissipates, setting up an explosive rally.
Conversely, a Bearish Butterfly presents a distinctive "W" shape indicating impending downside reversals. The CD leg drives aggressively above Point X, convincing momentum traders that an unstoppable breakout is underway. As price reaches the PRZ extension levels, institutional profit-taking frequently triggers sharp downward momentum.
These formations exploit classic market sentiment traps. When an asset reaches Point D, standard trend-following indicators appear deeply overbought or oversold, which makes counter-trend entries psychologically intimidating. Recognizing the underlying geometry helps you view these aggressive moves as calculated liquidity sweeps rather than genuine trend extensions.
How Do You Trade a Butterfly Harmonic Pattern? (A Step-by-Step Execution Plan)
Executing harmonic setups requires structured discipline, patience, and clear invalidation criteria rather than emotional anticipation. Professional standards outlined by bodies like the CFA Institute emphasize strict risk management over speculative pattern prediction.
Mapping the Potential Reversal Zone (PRZ) at Point D
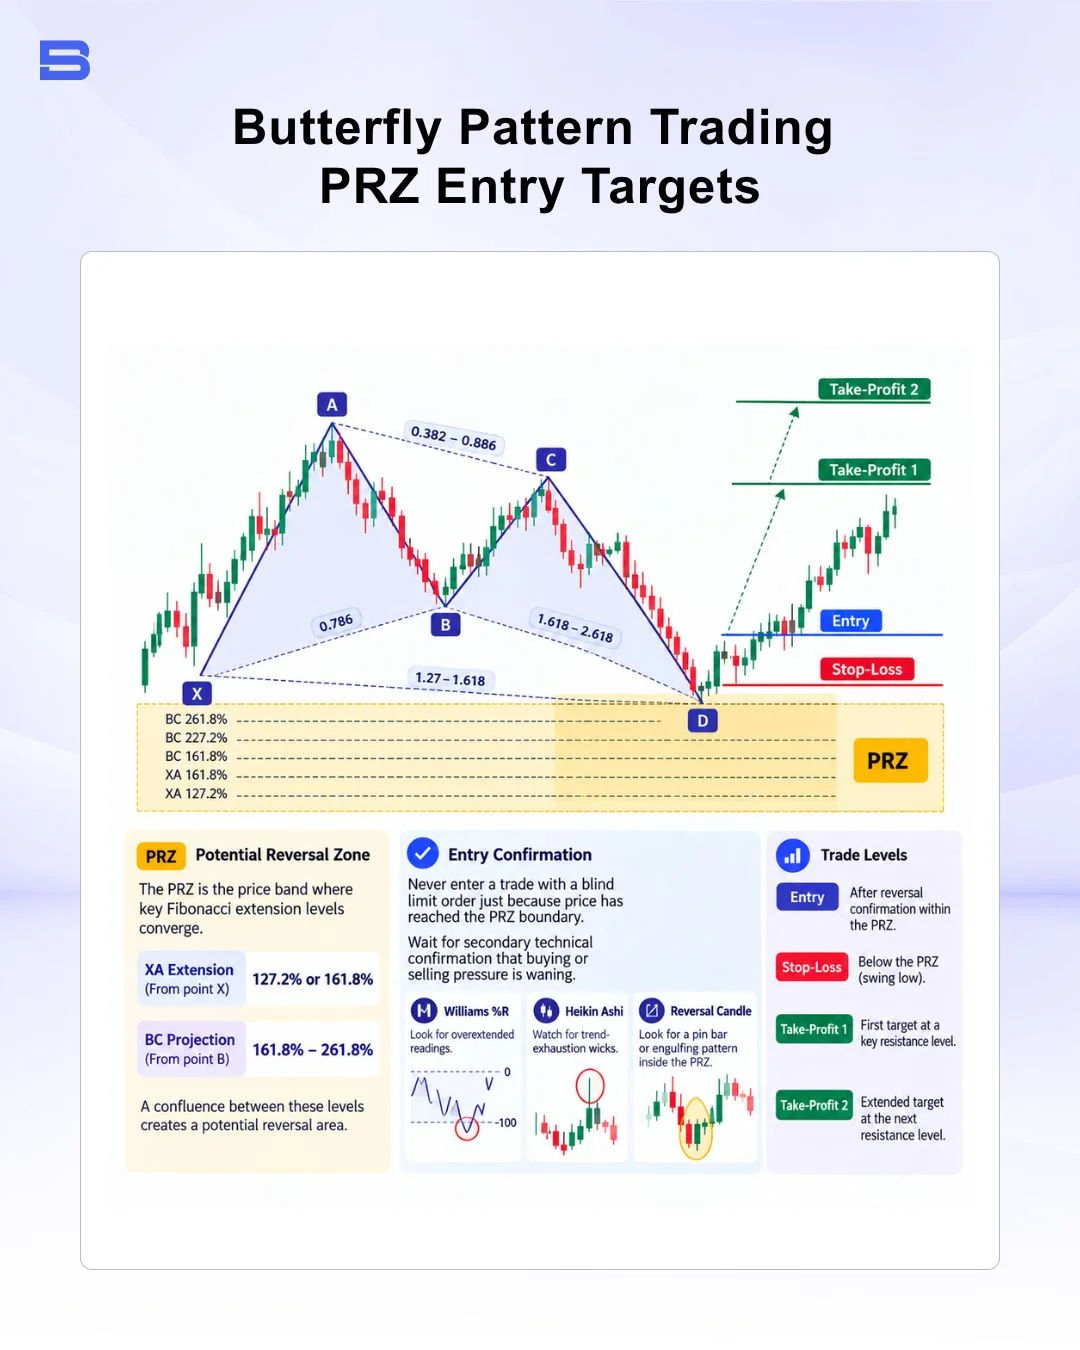
The Potential Reversal Zone (PRZ) is the price band where key Fibonacci extension levels converge to create a high-probability turning area. In a valid butterfly pattern trading, you look for a confluence between the 127.2% or 161.8% extension of XA and the 161.8% to 261.8% projection of the BC leg.
Never enter a trade with a blind limit order purely because price has reached the PRZ boundary. Wait for secondary technical confirmation to verify that buying or selling pressure is actively waning.
You can confirm structural exhaustion by monitoring oscillators like Williams %R for overextended readings, or by watching for trend-exhaustion wicks on a Heikin Ashi chart. When a reversal candle—such as a pin bar or an engulfing pattern—prints directly within the PRZ alongside momentum divergence, the trade setup becomes actionable.
Where Do You Place a Stop Loss on a Butterfly Pattern?
A proper stop-loss must be placed beyond the structural invalidation level of the pattern rather than at an arbitrary pip distance. For a standard Butterfly setup, technical invalidation occurs if the market breaks decisively past the 161.8% Fibonacci extension of the primary XA leg. Aligning your structural exit levels alongside key pivot point trading levels ensures your order is buffered against intraday volatility.
International supervisory principles established by the International Organization of Securities Commissions (IOSCO) emphasize that retail market participants must always account for execution slippage and leverage risks when placing contingent stop orders.
Consider this worked scenario on EUR/USD:
- Market Context: A Bearish Butterfly completes its CD leg into the PRZ.
- Point X: 1.0800
- Point A: 1.0700 (establishing an initial 100-pip XA swing)
- Entry (Point D): You enter a short position at 1.0827, corresponding to the 127.2% extension of XA, after a bearish engulfing candle confirms resistance.
- Stop-Loss: Placed at 1.0870, 8 pips above the 161.8% XA extension (1.0862), risking 43 pips.
- Take-Profit 1 (TP1): Set at the 38.2% retracement of the CD swing at 1.0770 (57 pips reward).
- Take-Profit 2 (TP2): Set at the 61.8% retracement of the CD swing at 1.0735 (92 pips reward).
In this setup, TP1 yields a 1:1.33 risk-to-reward ratio, while TP2 offers a 1:2.14 ratio. However, execution reality dictates that price will not always reverse cleanly. If strong macroeconomic announcements drive sudden order flow through the PRZ, slippage can push your exit beyond 1.0870, resulting in a larger loss than initially modeled.
Furthermore, trading this pattern with high leverage amplifies capital erosion if the market trends strongly beyond Point D without pausing. Reversal patterns carry failure rates, and preserving capital requires exiting immediately once the geometric invalidation level is breached.
The Bottom Line
Butterfly pattern trading provides a structured, quantitative framework for capitalizing on extreme market turns while strictly defining capital risk. Success with this geometric setup relies on respecting the non-negotiable 78.6% retracement anchor at Point B, maintaining discipline at the PRZ, and cutting losing positions without hesitation when the 161.8% extension level fails.
- How to Build an Investment Plan That Actually Works for You?
- What Is the MACD Indicator and How to Use It
- What Is a Wedge Pattern in Trading?
- What Is Ichimoku Cloud Strategy? A Complete Trading System
- Mastering Elliott Wave Theory: Rules and Trading Strategies
- News Trading: Strategies, Execution Risks, and Risk Control
- What Is an Iron Condor Options Strategy?
- Backtesting Explained: What It Is and Why It Really Matters
- Grid Trading: Mechanics, Parameters, and Risk Strategies
- What Is Breakout Trading and How Does It Work?
- Mean Reversion: Technical Strategies and Risk Frameworks
- Momentum Trading: Indicators, Strategies, and Risk Control
- Hammer Candlestick: Structure, Meaning, and Strategy
- Doji Candlestick: Types, Signals, and Trading Strategies
- What Is the Sharpe Ratio and How to Calculate It
- What Is VWAP and How Do Traders Use It?
- Trade the Ascending Triangle: A Step-by-Step Practical Guide
- What Is the Stochastic Oscillator and How to Use It
- How to Trade the Descending Triangle Pattern
- High Frequency Trading: Speed, Algorithms, and Market Impact
- What Is Volume Profile and How to Use It in Trading
- What Is a Morning Star Pattern Candlestick?
- Trade with Parabolic SAR: A Practical Analysis Guide
- Evening Star Pattern: Structure, Rules, and Risk Controls
- Kelly Criterion: Formula, Position Sizing, and Risk
- What Is the NYSE Minimum Trading Price? Rules Explained
Disclaimer: The content on this page is intended for educational and informational purposes only. It does not constitute financial, investment, tax, or legal advice, and should not be interpreted as a recommendation to buy, sell, or hold any financial instrument or asset. Trading and investing involve significant risk, including the possible loss of your entire capital. Products such as forex, CFDs, and cryptocurrencies carry additional risks due to leverage, high volatility, and limited regulatory protection in some jurisdictions. Past performance of any financial instrument does not guarantee future results. Any market views, forecasts, or opinions expressed are those of the author at the time of writing and may not reflect current market conditions. Platform features, fees, and regulatory status are subject to change — always verify information directly with the relevant provider or regulator before making any financial decision. BrokerSpecs may receive compensation from third parties featured on this site. Always conduct your own due diligence and consider seeking advice from a licensed financial professional before investing. Portions of this article were prepared with the assistance of AI tools and reviewed by our editorial team before publication.