


Related Tags
Imagine placing a trade with a fixed 20-pip stop loss on a calm Tuesday afternoon, only to watch a sudden burst of market activity wipe out your position in seconds before price moves back in your favored direction. This frustrating scenario happens frequently when traders rely on arbitrary point targets rather than adapting to current market conditions.
Price volatility changes constantly across different asset classes and trading sessions. The Average True Range (ATR) is a technical analysis indicator designed specifically to quantify this volatility, helping traders establish dynamic stop-loss levels and calculate precise position sizes based on actual market movement.
What Is Average True Range (ATR) and How Does It Work?
Developed by J. Welles Wilder Jr. and introduced in his 1978 book New Concepts in Technical Trading Systems, the Average True Range is a technical indicator that measures market volatility over a specified time period. Unlike directional indicators that attempt to predict price trends, ATR is purely non-directional. It calculates the total price movement of an asset, offering a clear reflection of price noise and volatility.
When an asset experiences sharp price swings, the ATR value rises. Conversely, during periods of market consolidation or low activity, the ATR value contracts. Traders rely on ATR to understand the typical distance an asset travels within a given timeframe, making it an essential tool for risk management rather than entry signal generation.
How Is Average True Range Calculated?
To understand ATR, you must first understand the concept of True Range (TR). Wilder recognized that simply taking the difference between the high and low of a current candle misses price gaps that occur between trading sessions. Therefore, the True Range is defined as the greatest absolute value among the following three calculations:
- Current High minus Current Low
- Current High minus Previous Close (absolute value)
- Current Low minus Previous Close (absolute value)
TR = max[(Highₜ − Lowₜ), |Highₜ − Closeₜ₋₁|, |Lowₜ − Closeₜ₋₁|]
Once the True Range is established for each period, the ATR is calculated by taking a moving average of these TR values. The standard default setting is 14 periods (e.g., 14 days on a daily chart, or 14 hours on an hourly chart).
ATRₜ = [(ATRₜ₋₁ × 13) + TRₜ] / 14
What Does ATR Tell You About Market Volatility?
The absolute value of the ATR line indicates whether market volatility is expanding or contracting. Analyzing high ATR vs low ATR dynamics provides critical context for trade execution:
- High ATR Values: Indicate wide price swings, heightened market volatility, and potential emotional trading activity. High volatility requires wider stop-loss distances to avoid getting stopped out prematurely by normal price fluctuations.
- Low ATR Values: Indicate narrow consolidation ranges, low market activity, and quiet price movement. Sustained periods of low ATR often precede explosive breakout movements as market energy builds.
A common misconception among intermediate traders is assuming that a rising ATR line signals a bullish price trend. High ATR reflects significant price movement regardless of direction; an aggressive sell-off produces a high ATR value just as a strong rally does. According to risk framework principles outlined by global standards such as the CFA Institute, separating volatility measurement from directional bias is vital for sound portfolio construction.
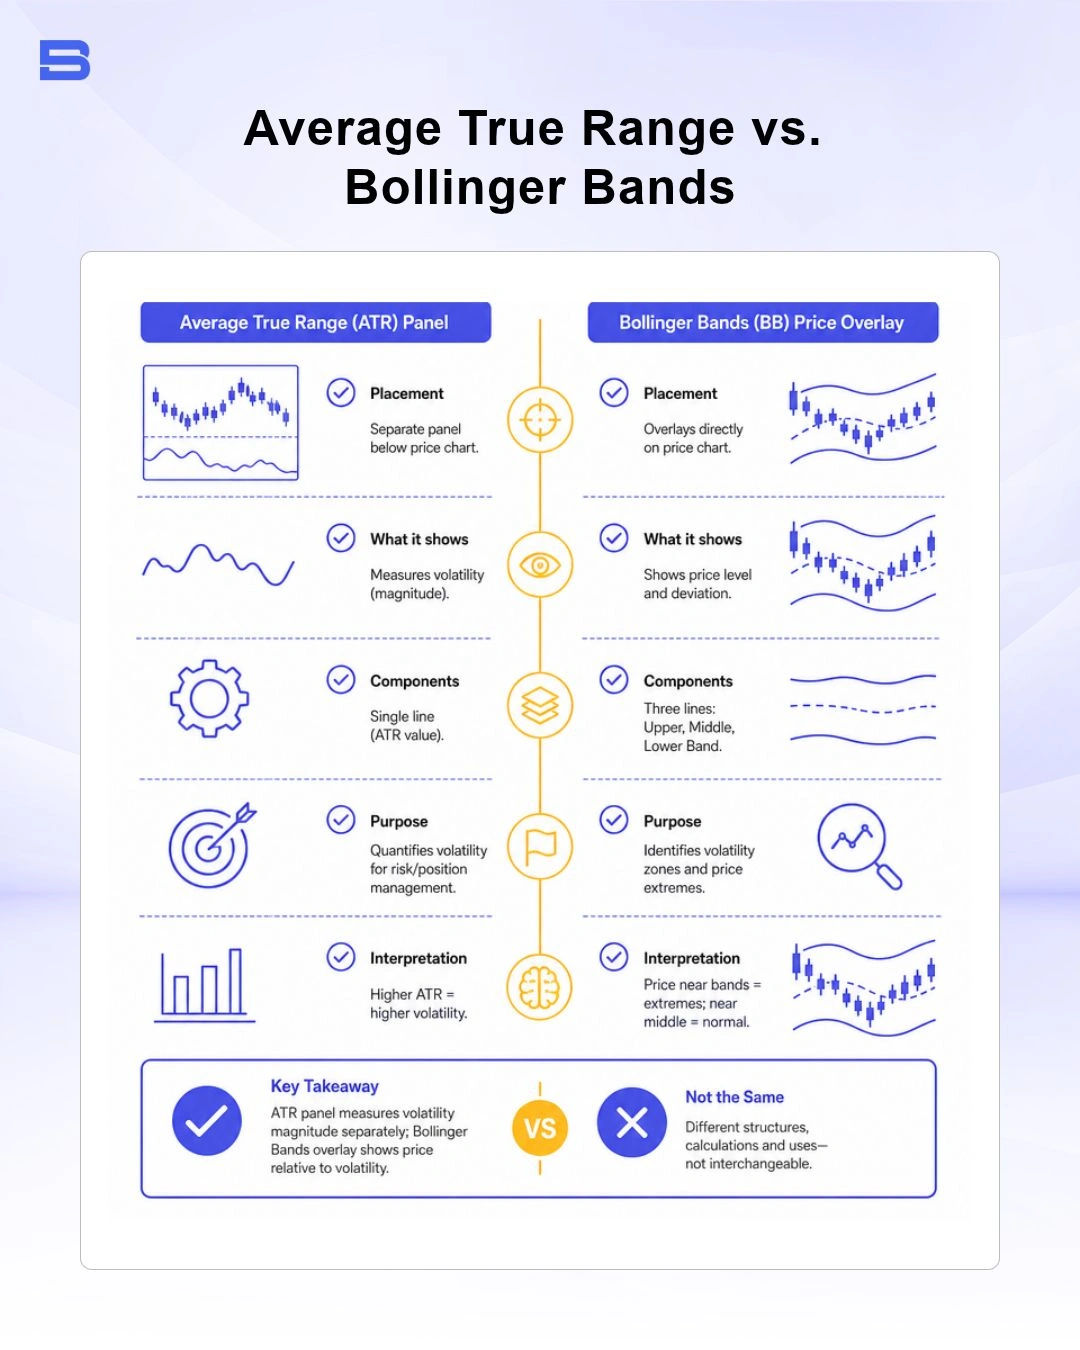
ATR vs. Bollinger Bands: What Is the Difference?
While both tools measure market volatility, they present data in fundamentally different formats.
How Do You Use ATR for Stop Loss and Position Sizing?
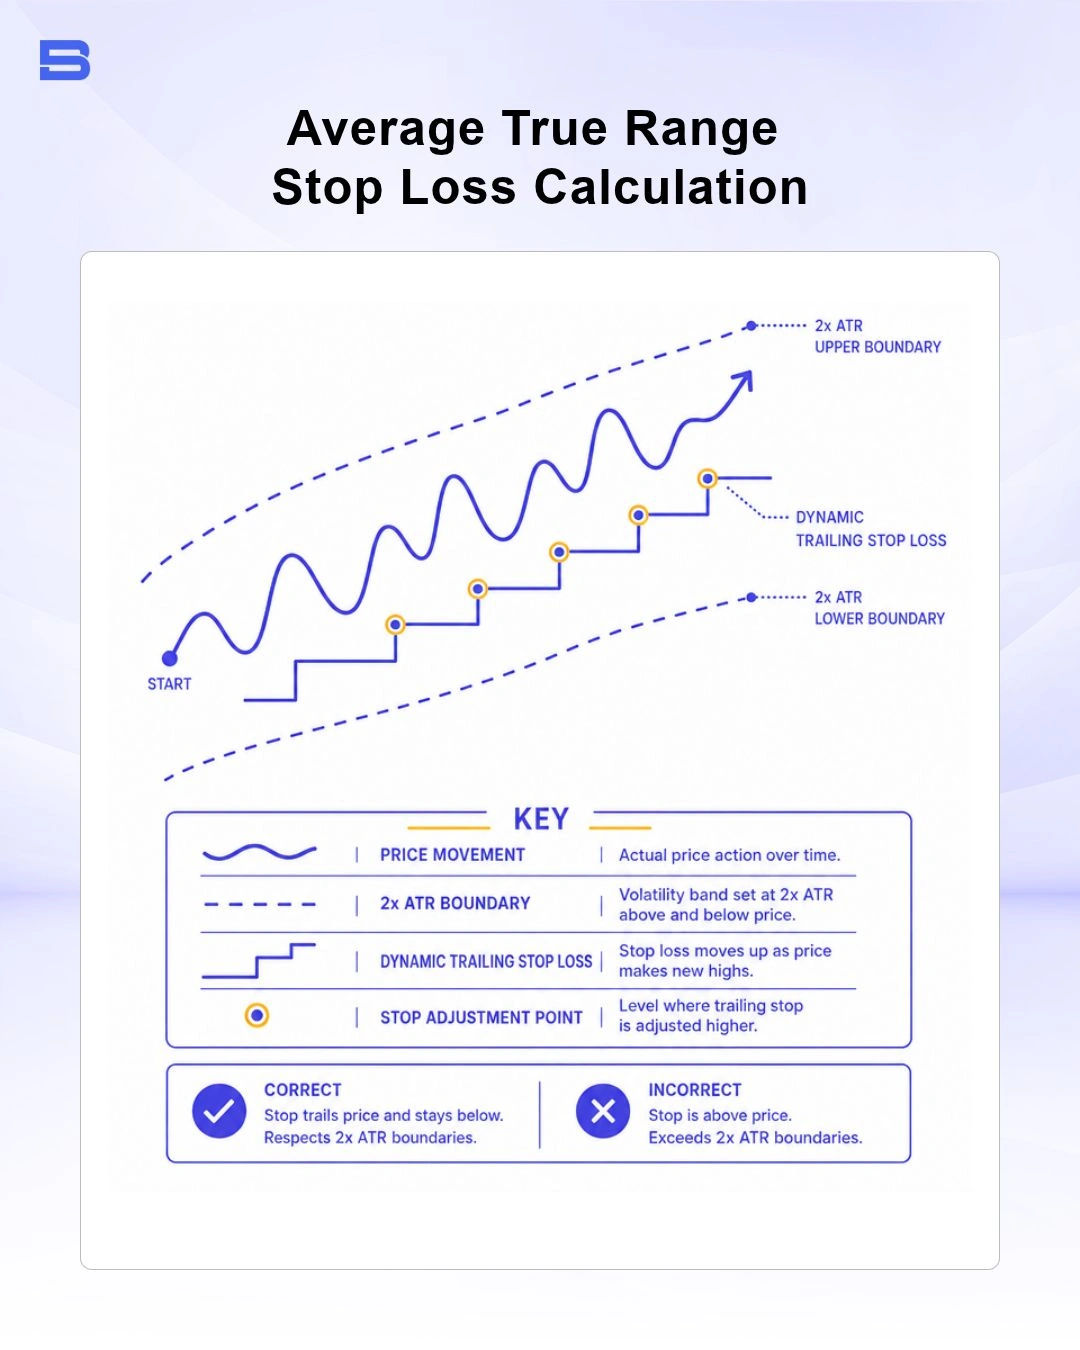
One of the most practical applications of ATR is setting volatility-based stop-loss levels. Instead of placing an arbitrary 30-pip stop loss, you can multiply the current ATR value by a specific factor (commonly 1.5x or 2.0x ATR) to set dynamic stop distances that scale naturally with market conditions.
Using leverage amplifies gains when price moves in your favor, but it accelerates capital destruction just as quickly when the market turns against you—making precise stop placement critical to preserving account equity. Regulatory authorities like the Financial Conduct Authority (FCA) consistently emphasize strict retail leverage constraints and rigorous risk management to mitigate capital depletion.
Worked Example: Calculating Stop Loss and Position Size
Consider a trade setup on the US Dollar and Japanese Yen (USD/JPY):
- Account Capital: $10,000
- Risk Tolerance Per Trade: 1% ($100)
- Current USD/JPY Price: 150.00
- Current 14-day ATR: 1.00 JPY (100 pips)
- Stop Loss Distance: 1.5 x ATR = 1.50 JPY (150 pips)
To determine your position size:
Dollar Risk = $100
Stop Distance = 150 pips
Pip Value Needed = $100 / 150 pips = $0.67 per pip
Since a standard lot (100,000 units) of USD/JPY has a pip value of approximately $6.67 at current rates, a pip value of $0.67 requires a position size of 0.10 mini lots (10,000 units).
If market volatility doubles and ATR rises to 2.00 JPY, your stop distance increases to 300 pips, automatically scaling down your position size to 0.05 lots to keep total account risk capped at exactly $100.
Limitations of Average True Range in Trading
While ATR is a useful tool for measuring volatility, it has several inherent limitations:
- Lagging Indicator: Because ATR relies on historical moving averages, its readings lag behind sudden real-time market shifts.
- No Directional Bias: ATR tells you how much price is moving, but never which way it will go.
- Susceptible to News Spikes: Isolated economic announcements can temporarily distort ATR readings, creating artificially inflated volatility expectations for subsequent periods.
To compensate for these limitations, ATR should not be used as a standalone entry signal. It works best when paired with trend indicators like the Moving Average Convergence Divergence (MACD) indicator or momentum tools like the Relative Strength Index (RSI) indicator to validate entries while managing risk. Additional structural tools like Fibonacci retracement or technical frameworks like the Ichimoku cloud can help identify high-probability price levels.
Conclusion
ATR is a useful technical indicator for measuring market volatility rather than predicting price direction. By understanding ATR readings, traders can adjust position sizes, set more practical stop-loss levels, and identify changing volatility conditions. When combined with other technical analysis tools and sound risk management, ATR can help traders make more informed decisions across different markets and timeframes.
- How to Build an Investment Plan That Actually Works for You?
- What Is the MACD Indicator and How to Use It
- What Is a Wedge Pattern in Trading?
- What Is Ichimoku Cloud Strategy? A Complete Trading System
- Mastering Elliott Wave Theory: Rules and Trading Strategies
- News Trading: Strategies, Execution Risks, and Risk Control
- What Is an Iron Condor Options Strategy?
- Backtesting Explained: What It Is and Why It Really Matters
- Grid Trading: Mechanics, Parameters, and Risk Strategies
- What Is Breakout Trading and How Does It Work?
- Mean Reversion: Technical Strategies and Risk Frameworks
- Momentum Trading: Indicators, Strategies, and Risk Control
- Hammer Candlestick: Structure, Meaning, and Strategy
- Doji Candlestick: Types, Signals, and Trading Strategies
- What Is the Sharpe Ratio and How to Calculate It
- What Is VWAP and How Do Traders Use It?
- Trade the Ascending Triangle: A Step-by-Step Practical Guide
- What Is the Stochastic Oscillator and How to Use It
- How to Trade the Descending Triangle Pattern
- High Frequency Trading: Speed, Algorithms, and Market Impact
- What Is Volume Profile and How to Use It in Trading
- What Is a Morning Star Pattern Candlestick?
- Trade with Parabolic SAR: A Practical Analysis Guide
- Evening Star Pattern: Structure, Rules, and Risk Controls
- Kelly Criterion: Formula, Position Sizing, and Risk
- What Is the NYSE Minimum Trading Price? Rules Explained
Disclaimer: The content on this page is intended for educational and informational purposes only. It does not constitute financial, investment, tax, or legal advice, and should not be interpreted as a recommendation to buy, sell, or hold any financial instrument or asset. Trading and investing involve significant risk, including the possible loss of your entire capital. Products such as forex, CFDs, and cryptocurrencies carry additional risks due to leverage, high volatility, and limited regulatory protection in some jurisdictions. Past performance of any financial instrument does not guarantee future results. Any market views, forecasts, or opinions expressed are those of the author at the time of writing and may not reflect current market conditions. Platform features, fees, and regulatory status are subject to change — always verify information directly with the relevant provider or regulator before making any financial decision. BrokerSpecs may receive compensation from third parties featured on this site. Always conduct your own due diligence and consider seeking advice from a licensed financial professional before investing. Portions of this article were prepared with the assistance of AI tools and reviewed by our editorial team before publication.