



Related Tags
You open a daily forex or stock chart and notice the price is climbing steadily, yet it refuses to move in a straight vertical line. Instead, candles rally, pull back slightly, rally to a fresh peak, and pull back again along a remarkably consistent upward corridor.
Recognizing that corridor as a structured chart pattern helps you map out where buyers historically step in and where profit-taking tends to stall momentum. Just as importantly, knowing the exact boundaries of an ascending channel can help you limit losses when an uptrend runs out of steam and breaks downward.
What Is an Ascending Channel Pattern and How Does It Form?
An ascending channel pattern is a bullish technical chart formation bounded by two parallel, upward-sloping trendlines that connect higher swing highs and higher swing lows.
In market terms, the lower trendline acts as dynamic support where buying demand repeatedly absorbs selling pressure. The upper trendline functions as dynamic resistance where traders lock in gains or initiate short-term counter-trend positions, a core principle of trendline analysis taught in standard CFA Institute technical analysis frameworks.
While traders classify the ascending channel as a trend-continuation structure, it is never a guarantee that prices will keep climbing indefinitely. Because buyers must commit fresh capital at progressively higher prices to maintain the slope, upward momentum can weaken mid-channel before price even reaches the upper boundary.
When demand fades and sellers force a decisive close below the lower support line, the pattern shifts from trend continuation to a bearish breakdown. Recognizing both the bullish bounce potential and the bearish breakdown risk keeps your analysis objective rather than one-sided.
How to Draw an Ascending Channel Pattern Step by Step
Drawing an accurate ascending channel requires clean anchor points rather than forcing lines through candle bodies to fit a bias.
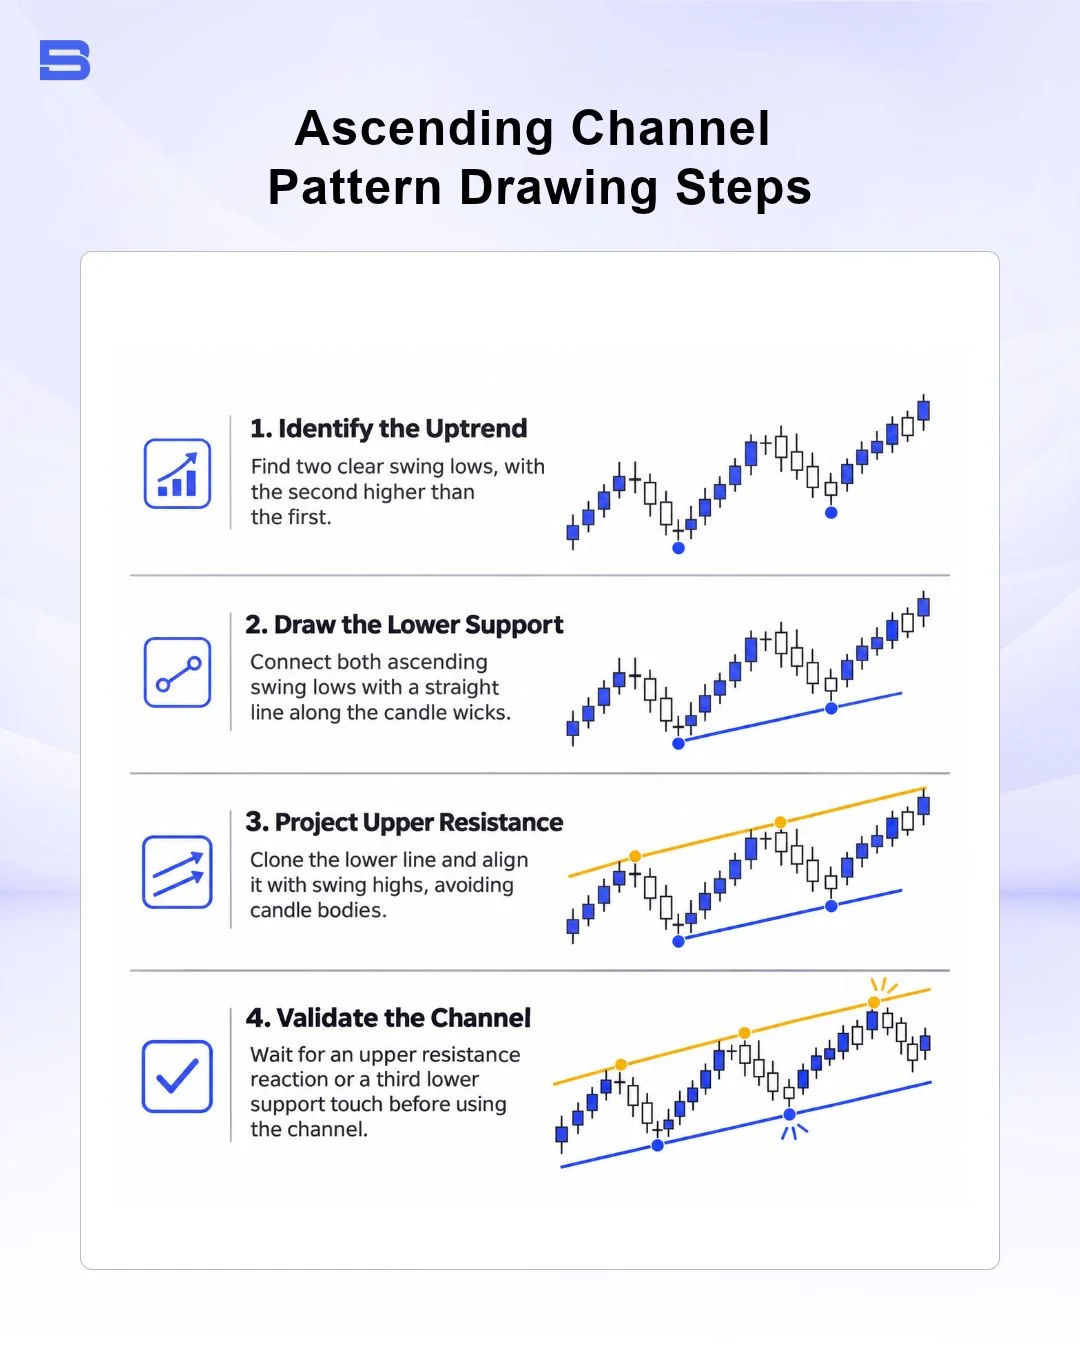
- Identify an established uptrend: Confirm that price action is printing at least two clear swing lows where the second low sits noticeably higher than the first.
- Draw the lower support trendline: Connect those two ascending swing lows using a straight line anchored along the candle wicks.
- Project the parallel upper channel line: Clone the lower trendline and drag it upward until it rests cleanly across the intervening swing highs without slicing through the main bodies of recent candles.
- Validate with a fourth touchpoint: Wait for price to react off the projected upper resistance or return to test the lower support a third time before treating the corridor as an actionable channel.
If you have to bend the angle or cut through multiple candle bodies just to make the lines look parallel, the market is likely moving in an irregular trend rather than a valid channel.
How to Trade an Ascending Channel Pattern: Swing vs. Breakout Setups
Once four touchpoints confirm the channel boundaries, you can approach the formation either by trading swings inside the corridor or by waiting for a decisive exit outside it.
Trading Bounces Inside the Channel
Range-bound swing traders look for long entries when price pulls back to the lower support trendline and prints a bullish rejection candle, such as a hammer or bullish engulfing bar. Profit targets are typically placed just below the upper resistance line, where buying momentum often stalls.
Many intermediate traders also plot a dashed midline halfway between both trendlines to gauge internal strength. When price repeatedly bounces off the midline without reaching lower support, upward momentum may be strong, whereas failure to reach the midline can warn that buyers are losing control.
Trading Breakouts and Breakdowns
Breakout traders stay flat while price oscillates inside the lines and wait for a full candle close outside the channel boundaries. An upside breakout above resistance may signal accelerating demand, though sharp upward spikes out of already steep channels often exhaust themselves quickly.
Downside breakdowns below lower support can occur in maturing uptrends and may unwind faster than upside breakouts. Waiting for a confirmed close below support—or a failed retest of the broken line from underneath—helps filter out momentary intraday dips.
Worked Trade Example with Risk Calculation
Suppose EUR/USD is trading inside a clean four-hour ascending channel, and you hold a $10,000 trading account with a strict 1% maximum risk rule ($100 per trade).
Price pulls back to touch the lower support trendline at 1.0850 and forms a bullish rejection candle. You place a buy limit at 1.0850, set your stop-loss 40 pips below the trendline at 1.0810 to allow for normal noise, and target upper channel resistance at 1.0950 for a 100-pip gain.
With a 40-pip stop-loss and a $100 risk cap, you calculate your position size at 0.25 standard lots ($2.50 per pip). If price reaches 1.0950, you earn $250 (a 2.5:1 reward-to-risk ratio), whereas if support fails and hits 1.0810, your loss is capped at $100 before slippage or swap costs.
Ascending Channel vs. Rising Wedge and Ascending Triangle
Because all three formations appear during upward price movement, traders frequently confuse parallel channels with converging chart structures.
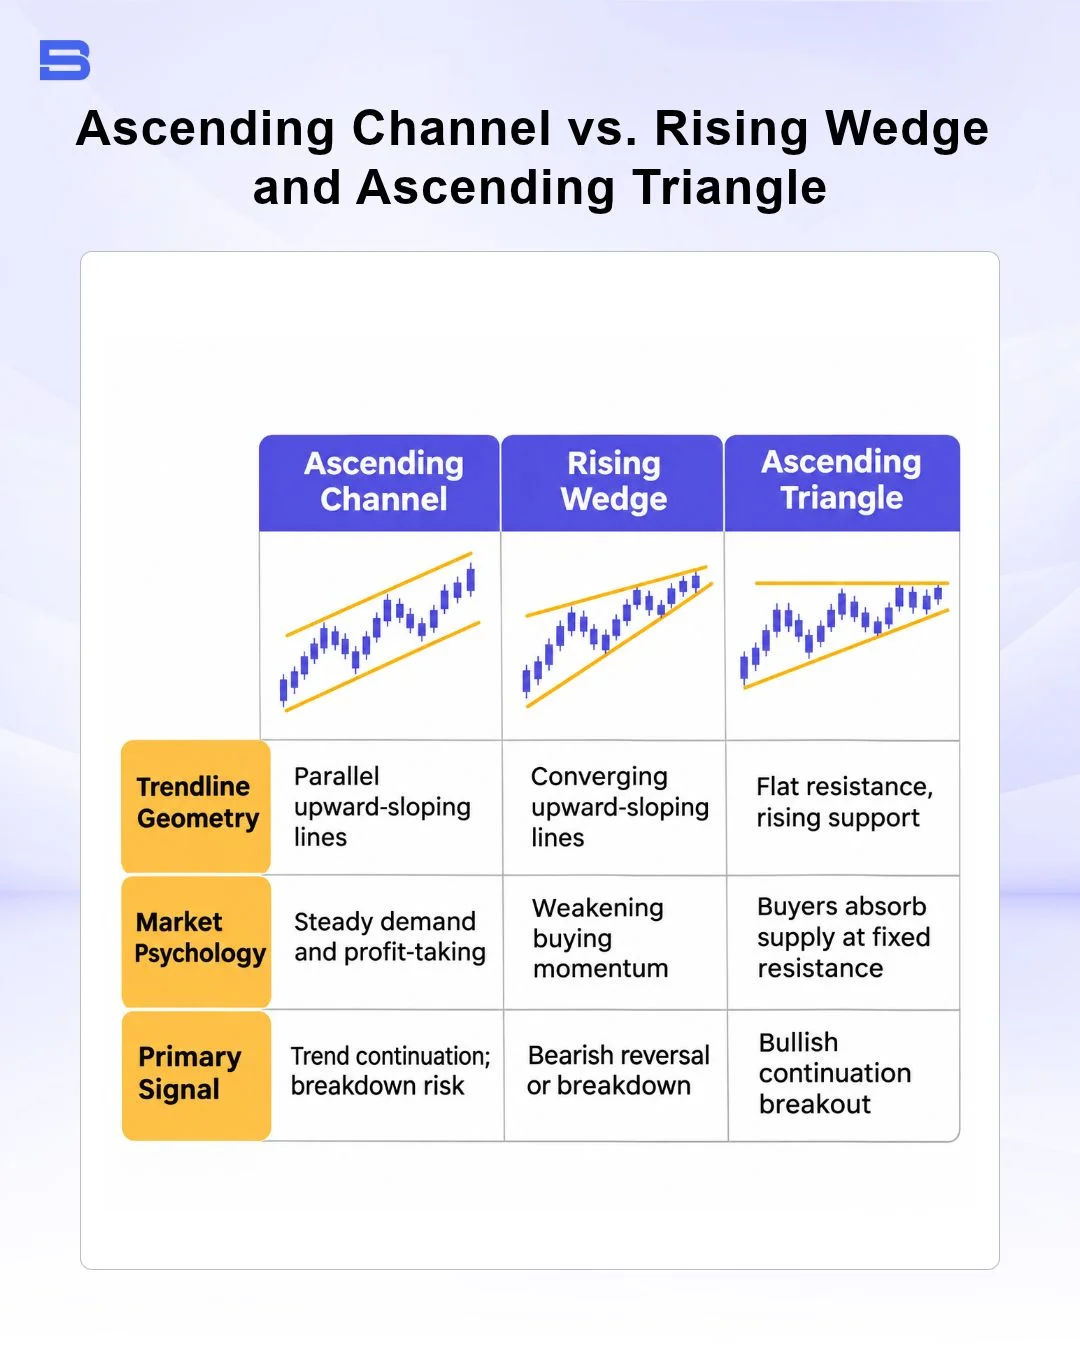
An ascending channel maintains a consistent width between support and resistance, whereas a rising wedge pattern narrows as higher lows climb faster than higher highs. By contrast, a descending channel pattern mirrors the ascending channel’s parallel geometry in reverse, sloping downward to track lower highs and lower lows during a downtrend.
An ascending triangle, on the other hand, combines a flat horizontal resistance line with a rising support line, so the pattern converges toward an apex instead of keeping a constant width.
Common Mistakes and Risks When Trading Ascending Channels
Buying blindly near the upper resistance line is one of the fastest ways to suffer an immediate drawdown, even when the broader trend points higher. Entering near the top of the corridor leaves almost no room before resistance triggers profit-taking, forcing you to place an excessively wide stop-loss.
Steep channel angles present another overlooked hazard because vertical rallies rarely sustain their pace. When a channel slopes sharply upward, even a brief pause in buying pressure can slice straight through lower support without warning.
False breakouts also trap impatient traders on both sides of the pattern. A brief wick above upper resistance can trigger a bull trap right before price reverses back into the channel, while a shallow dip below support can spring a bear trap before the uptrend resumes.
Trading channels on leveraged CFD or forex accounts magnifies both your potential gains and your potential losses, meaning a sudden breakdown against an oversized position can rapidly deplete your margin. As highlighted in the International Organization of Securities Commissions (IOSCO) report on retail over-the-counter (OTC) leveraged products, rolling-spot forex contracts and CFDs expose retail investors to significant risk. Defining your exit levels in a written trading plan before entering any leveraged trade can help you control downside exposure.
Conclusion
An ascending channel pattern gives you a structured visual framework for tracking higher highs and higher lows while defining exact boundaries for support and resistance. By waiting for four validated touchpoints, calculating position size around clear stop-loss levels, and respecting the risk of downward breakdowns, you can trade uptrending corridors with disciplined risk control.
- How to Build an Investment Plan That Actually Works for You?
- What Is the MACD Indicator and How to Use It
- What Is a Wedge Pattern in Trading?
- What Is Ichimoku Cloud Strategy? A Complete Trading System
- Mastering Elliott Wave Theory: Rules and Trading Strategies
- News Trading: Strategies, Execution Risks, and Risk Control
- What Is an Iron Condor Options Strategy?
- Backtesting Explained: What It Is and Why It Really Matters
- Grid Trading: Mechanics, Parameters, and Risk Strategies
- What Is Breakout Trading and How Does It Work?
- Mean Reversion: Technical Strategies and Risk Frameworks
- Momentum Trading: Indicators, Strategies, and Risk Control
- Hammer Candlestick: Structure, Meaning, and Strategy
- Doji Candlestick: Types, Signals, and Trading Strategies
- What Is the Sharpe Ratio and How to Calculate It
- What Is VWAP and How Do Traders Use It?
- Trade the Ascending Triangle: A Step-by-Step Practical Guide
- What Is the Stochastic Oscillator and How to Use It
- How to Trade the Descending Triangle Pattern
- High Frequency Trading: Speed, Algorithms, and Market Impact
- What Is Volume Profile and How to Use It in Trading
- What Is a Morning Star Pattern Candlestick?
- Trade with Parabolic SAR: A Practical Analysis Guide
- Evening Star Pattern: Structure, Rules, and Risk Controls
- Kelly Criterion: Formula, Position Sizing, and Risk
- What Is the NYSE Minimum Trading Price? Rules Explained
Disclaimer: The content on this page is intended for educational and informational purposes only. It does not constitute financial, investment, tax, or legal advice, and should not be interpreted as a recommendation to buy, sell, or hold any financial instrument or asset. Trading and investing involve significant risk, including the possible loss of your entire capital. Products such as forex, CFDs, and cryptocurrencies carry additional risks due to leverage, high volatility, and limited regulatory protection in some jurisdictions. Past performance of any financial instrument does not guarantee future results. Any market views, forecasts, or opinions expressed are those of the author at the time of writing and may not reflect current market conditions. Platform features, fees, and regulatory status are subject to change — always verify information directly with the relevant provider or regulator before making any financial decision. BrokerSpecs may receive compensation from third parties featured on this site. Always conduct your own due diligence and consider seeking advice from a licensed financial professional before investing. Portions of this article were prepared with the assistance of AI tools and reviewed by our editorial team before publication.