


Related Tags
You are watching a sustained trend push relentlessly toward new highs, enticing breakout traders to buy every new peak. Suddenly, the third aggressive push stalls immediately after clearing resistance, reversing sharply and trapping late buyers who expected a sustained breakout.
This recurring structural trap is often a textbook three drives pattern, an advanced price formation that alerts attentive traders to trend exhaustion before the broader market catches on.
What Is the Three Drives Pattern?
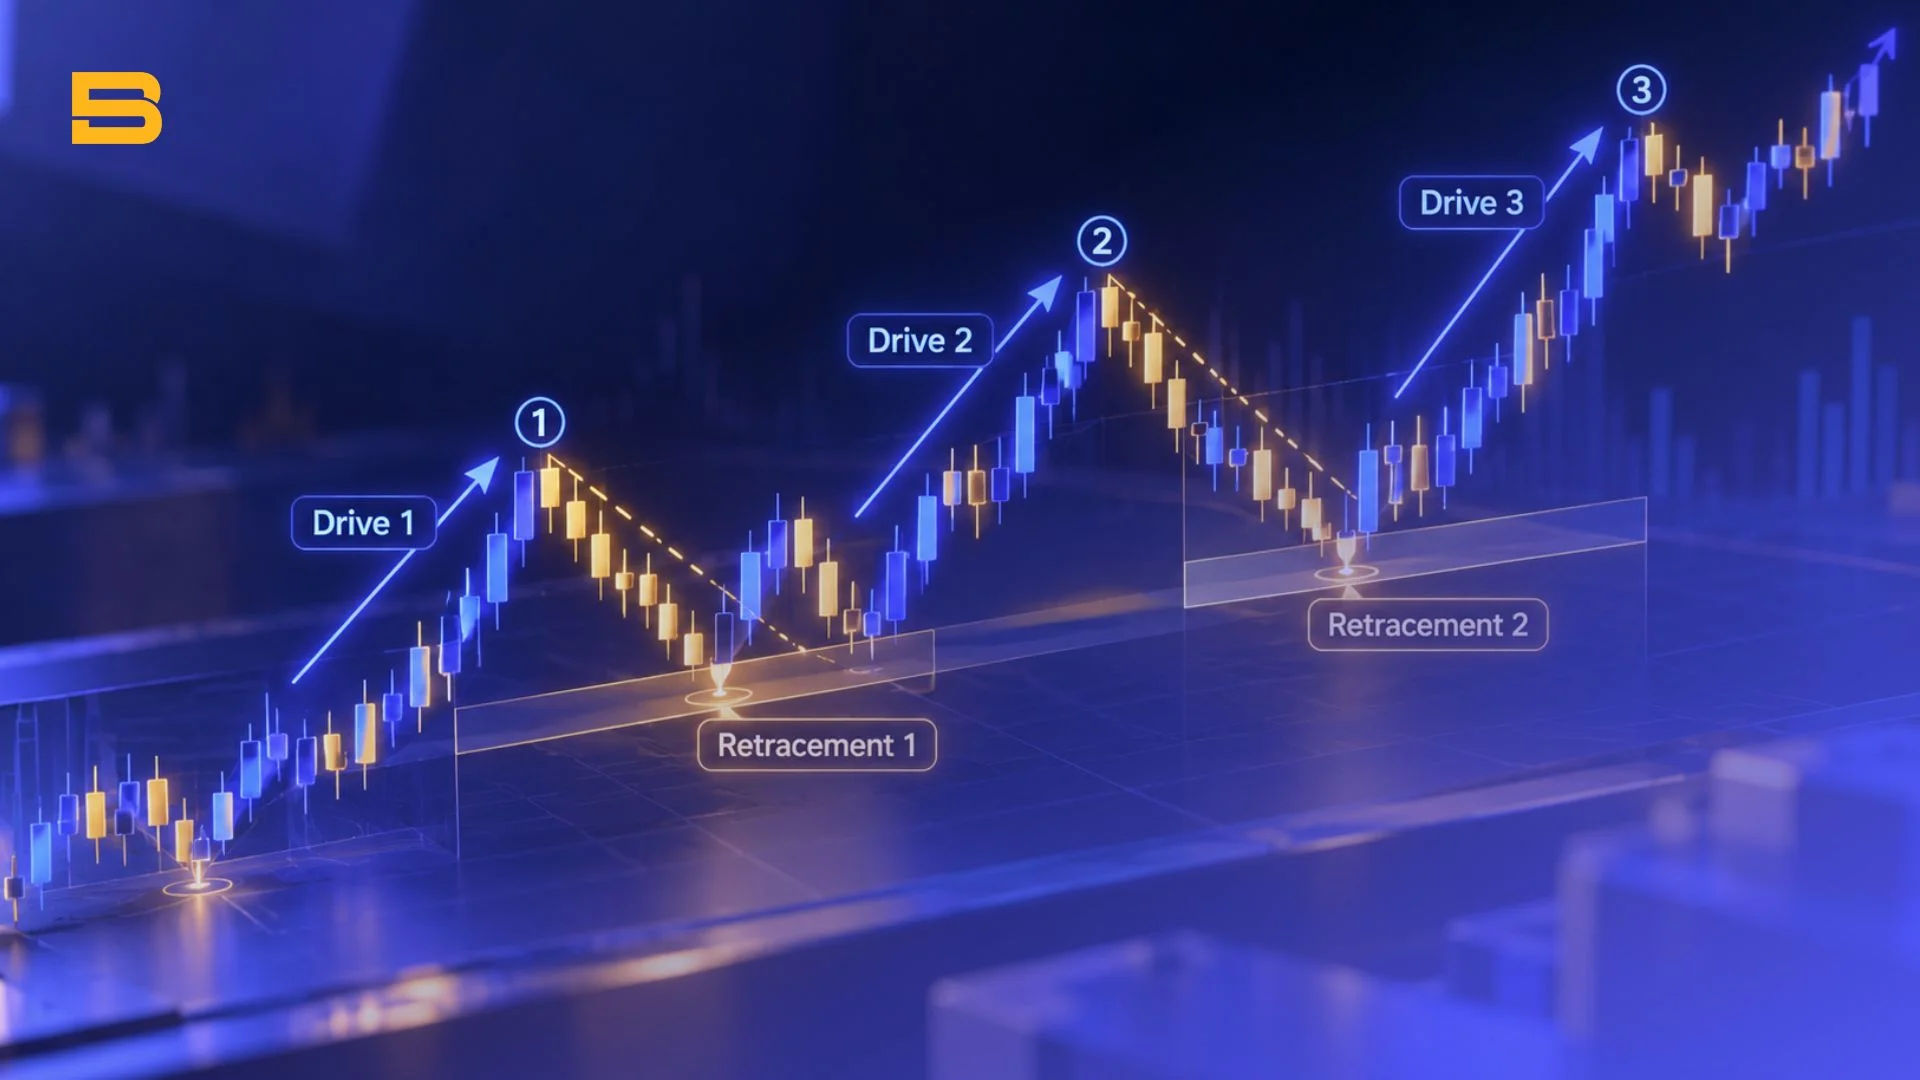
A three drives pattern is a specialized harmonic reversal setup characterized by three consecutive, symmetrical price thrusts accompanied by two intervening pullbacks. First formalized in technical literature as an extension of geometric price analysis, this structure identifies points where market momentum reaches structural exhaustion.
Each drive establishes a new extreme—either higher highs in an uptrend or lower lows in a downtrend—before encountering strong opposing order flow.
Unlike standard trending swings, a genuine three drives setup demands strict symmetry in both price range and elapsed time. The pattern consists of five key structural points: Drive 1, Pullback A, Drive 2, Pullback C, and Drive 3. If the distance between Drive 1 and Drive 2 takes twelve trading candles to develop, Drive 3 must mirror that elapsed duration closely.
When price and time converge with geometric balance, institutional participants often use the final thrust to absorb lingering liquidity. Recognizing this structural cadence helps you separate orderly exhaustion from runaway momentum.
Three Drives Pattern Rules and Fibonacci Ratios
Validating this formation requires applying strict mathematical rules rather than relying on visual guesswork. Like the classic ABCD pattern and the broader family of Harmonic pattern setups such as Butterfly pattern trading, the three drives structure relies entirely on harmonic ratios. If price action violates these Fibonacci coordinates, the setup loses its statistical edge and should be discarded.
The structural integrity of the pattern depends on two interrelated measurements:
- Retracement Depth: After Drive 1 terminates, Pullback A must retrace either 61.8% or 78.6% of that initial move, measured via standard Fibonacci retracement tools. Following Drive 2, Pullback C must exhibit a similar retracement depth of 61.8% or 78.6% relative to the second drive.
- Extension Targets: Drive 2 must extend to exactly 127.2% or 161.8% of Pullback A's price swing. Drive 3 must similarly terminate at the 127.2% or 161.8% extension of Pullback C.
- Time Symmetry: The duration required for Drive 2 to form after Pullback A should roughly equal the time elapsed between Pullback C and Drive 3.
Symmetry is what validates harmonic integrity. If Drive 2 extends to the 127.2% level, Drive 3 should ideally terminate at 127.2% rather than overextending to 161.8%. When price overshoots the 161.8% extension significantly, it signals intense directional momentum rather than structural exhaustion, invalidating the reversal thesis.
Identifying Bullish and Bearish Three Drives Setups
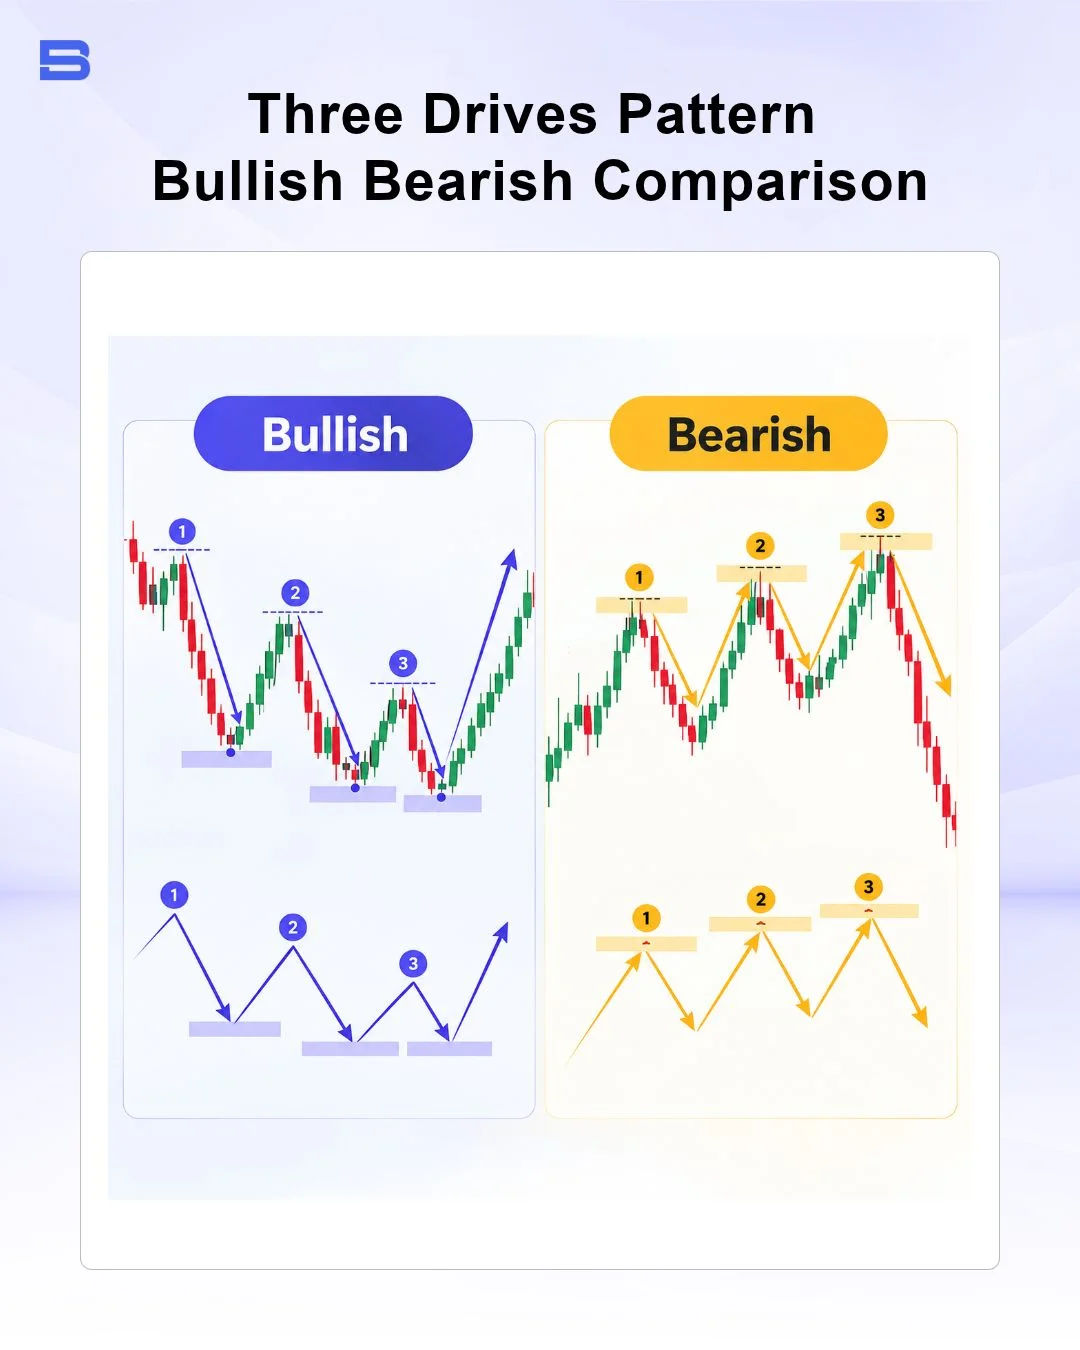
The pattern appears in two distinct market environments, signaling either impending downside reversals or prospective upward rallies. In a bearish three drives setup, the market prints three consecutive higher highs, each pushing into harmonic resistance while momentum oscillators typically show bearish divergence.
Buyers become progressively less aggressive on each consecutive drive, leaving the final high vulnerable to rapid liquidation.
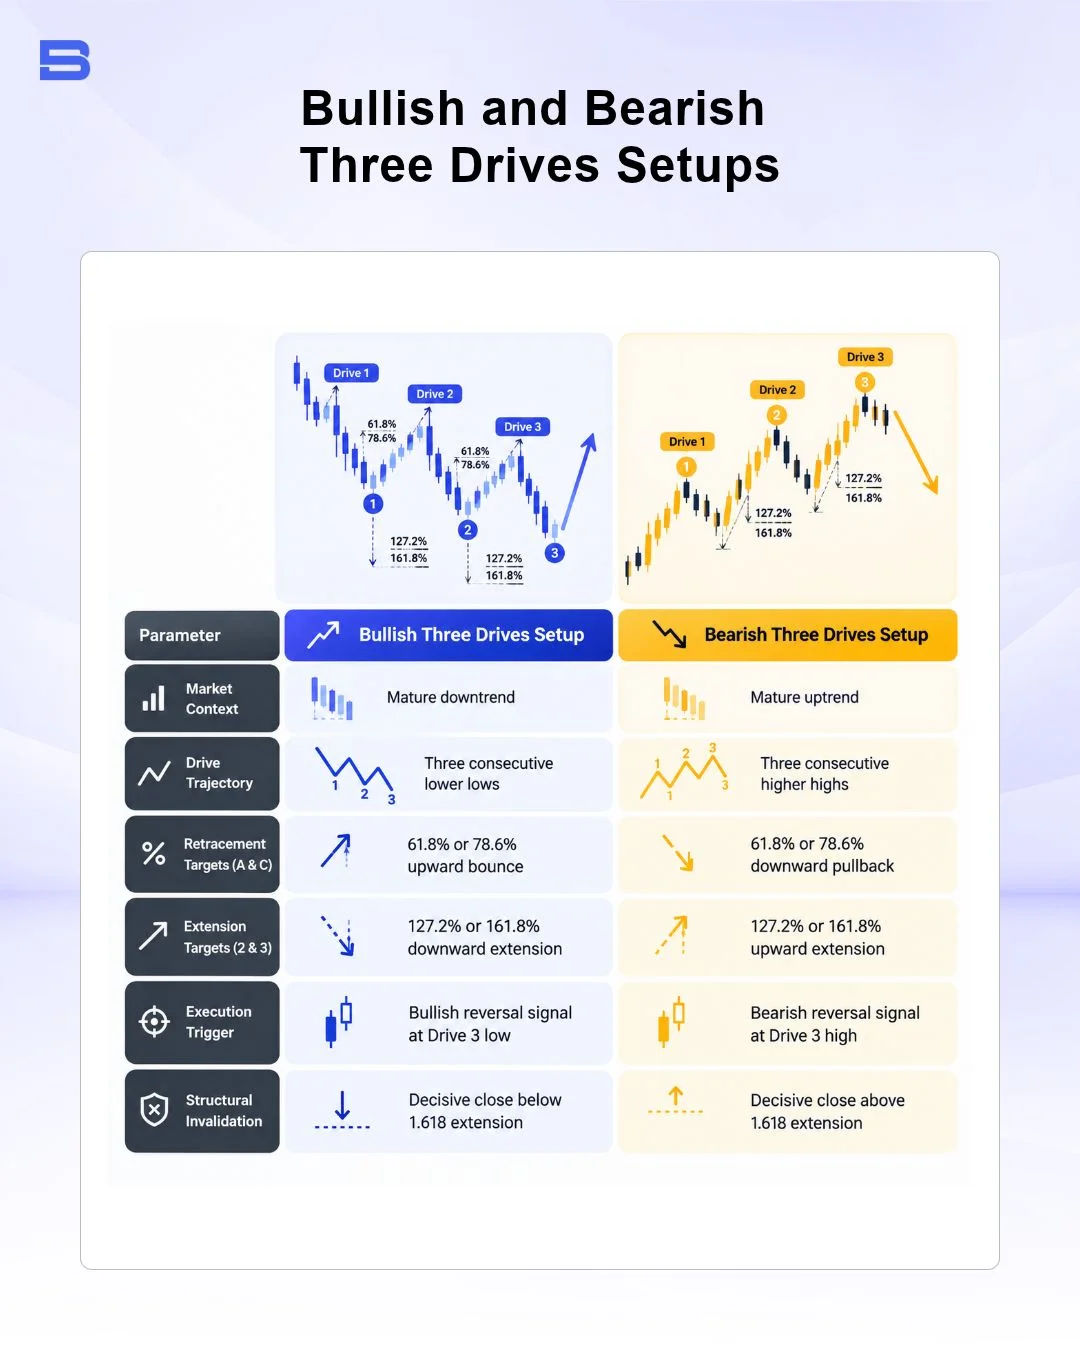
Conversely, a bullish three drives setup unfolds across a mature downtrend through three consecutive lower lows. Each downward thrust triggers retail stop-loss orders and panic selling into the projected Fibonacci extension zones. As selling volume diminishes on Drive 3, institutional buyers step in to absorb cheap liquidity, setting the stage for a sharp upward rebound.
Evaluating the broader trend context is essential before committing capital. A three drives structure that forms directly into major daily support or resistance carries substantially higher probability than one developing in the middle of a choppy range.
Execution Strategy: Trading the Three Drives Pattern
Executing trades around harmonic patterns requires patience and structured confirmation. Entering with a blind limit order precisely at the 127.2% extension is dangerous because strong trends can easily slice through Fibonacci projections. Instead, wait for Drive 3 to print a definitive price rejection, such as a pin bar, engulfing candle, or indicator divergence, confirming that opposing participants have entered the market.
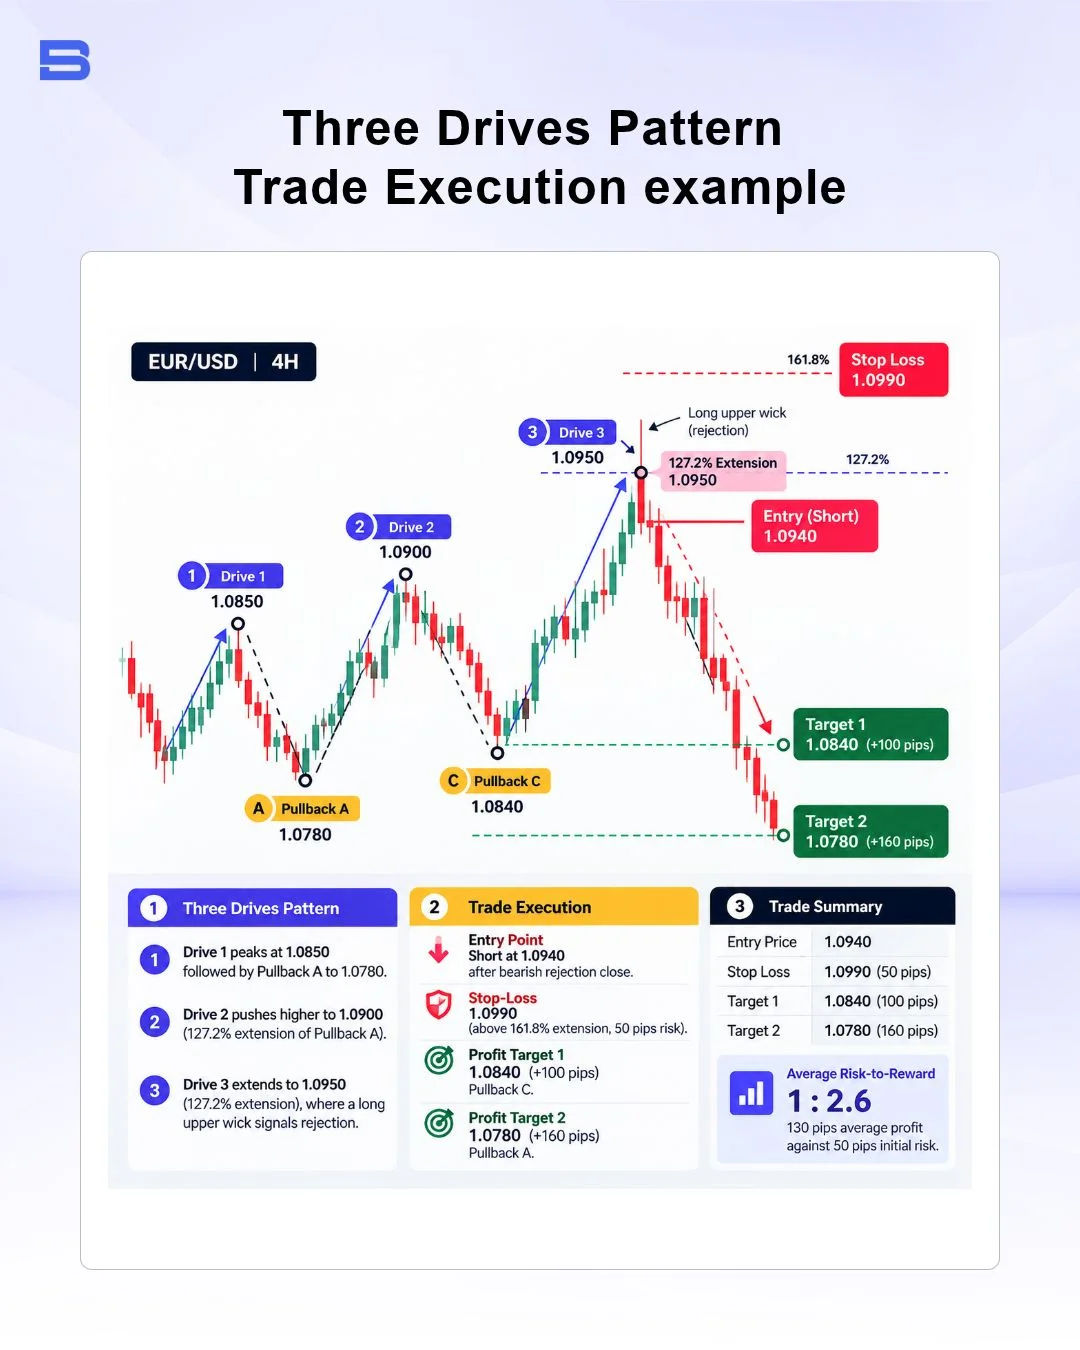
Consider a worked scenario on the EUR/USD 4-hour chart. Suppose the pair forms a bearish three drives setup where Drive 1 peaks at 1.0850, followed by Pullback A to 1.0780. Drive 2 pushes higher to 1.0869 (a 127.2% extension of Pullback A), followed by Pullback C dropping to 1.0814. Drive 3 extends upward to touch the 127.2% extension of Pullback C at 1.0884, where a long upper wick signals rejection.
- Entry Point: You execute a short position at 1.0874 following the bearish rejection close.
- Stop-Loss Placement: Your hard stop-loss is placed above the structural invalidation level at 1.0903, just beyond the 161.8% extension, risking 29 pips.
- Profit Targets: Target 1 is established at Pullback C (1.0814, securing 60 pips), and Target 2 sits at Pullback A (1.0780, securing 94 pips).
- Risk-to-Reward Ratio: Blending both targets produces an average profit objective of 77 pips against a 29-pip initial risk, yielding a favorable 1:2.66 risk-to-reward ratio.
Risk management frameworks published by the CFA Institute emphasize strict position sizing, reminding traders that no technical pattern guarantees execution outcomes. Leverage amplifies your returns when you catch an optimal reversal, but it accelerates capital destruction just as quickly when momentum overrides harmonic resistance; a small adverse move against an overleveraged margin account can trigger rapid liquidation.
Regulatory bodies like the Financial Conduct Authority (FCA) regularly warn retail investors that the vast majority of leveraged CFD and forex accounts lose money due to inadequate risk control. Setting protective stops beyond the 161.8% extension ensures you exit immediately when market conditions invalidate the trade thesis.
Comparing the Three Drives Pattern vs. Elliott Wave Theory
Traders frequently confuse the three drives structure with an Elliott Wave 5-wave impulse sequence because both display three distinct progressive thrusts. However, their core mechanics, mathematical constraints, and tactical objectives differ significantly.
An Elliott Wave impulse structure represents a trending sequence where Wave 3 is frequently extended and cannot be the shortest wave among Waves 1, 3, and 5. In contrast, this harmonic setup requires strict proportional symmetry between Drive 2 and Drive 3, with roughly equal price lengths and elapsed candle counts.
Furthermore, Elliott Wave analysis is commonly employed to trade trend continuation during Waves 3 and 5, whereas the formation exists exclusively as a counter-trend reversal setup traded at the culmination of Drive 3. Recognizing these distinctions prevents you from shorting a powerful Elliott third wave under the false assumption that it is merely an exhausting harmonic drive.
Final Thoughts
The three drives pattern offers a structured, mathematically defined blueprint for identifying market exhaustion across trending assets. By waiting patiently for Drive 3 confirmation, validating time and price symmetry, and strictly honoring protective stop-loss boundaries, you can navigate turning points with disciplined risk control.
- How to Build an Investment Plan That Actually Works for You?
- What Is the MACD Indicator and How to Use It
- What Is a Wedge Pattern in Trading?
- What Is Ichimoku Cloud Strategy? A Complete Trading System
- Mastering Elliott Wave Theory: Rules and Trading Strategies
- News Trading: Strategies, Execution Risks, and Risk Control
- What Is an Iron Condor Options Strategy?
- Backtesting Explained: What It Is and Why It Really Matters
- Grid Trading: Mechanics, Parameters, and Risk Strategies
- What Is Breakout Trading and How Does It Work?
- Mean Reversion: Technical Strategies and Risk Frameworks
- Momentum Trading: Indicators, Strategies, and Risk Control
- Hammer Candlestick: Structure, Meaning, and Strategy
- Doji Candlestick: Types, Signals, and Trading Strategies
- What Is the Sharpe Ratio and How to Calculate It
- What Is VWAP and How Do Traders Use It?
- Trade the Ascending Triangle: A Step-by-Step Practical Guide
- What Is the Stochastic Oscillator and How to Use It
- How to Trade the Descending Triangle Pattern
- High Frequency Trading: Speed, Algorithms, and Market Impact
- What Is Volume Profile and How to Use It in Trading
- What Is a Morning Star Pattern Candlestick?
- Trade with Parabolic SAR: A Practical Analysis Guide
- Evening Star Pattern: Structure, Rules, and Risk Controls
- Kelly Criterion: Formula, Position Sizing, and Risk
- What Is the NYSE Minimum Trading Price? Rules Explained
Disclaimer: The content on this page is intended for educational and informational purposes only. It does not constitute financial, investment, tax, or legal advice, and should not be interpreted as a recommendation to buy, sell, or hold any financial instrument or asset. Trading and investing involve significant risk, including the possible loss of your entire capital. Products such as forex, CFDs, and cryptocurrencies carry additional risks due to leverage, high volatility, and limited regulatory protection in some jurisdictions. Past performance of any financial instrument does not guarantee future results. Any market views, forecasts, or opinions expressed are those of the author at the time of writing and may not reflect current market conditions. Platform features, fees, and regulatory status are subject to change — always verify information directly with the relevant provider or regulator before making any financial decision. BrokerSpecs may receive compensation from third parties featured on this site. Always conduct your own due diligence and consider seeking advice from a licensed financial professional before investing. Portions of this article were prepared with the assistance of AI tools and reviewed by our editorial team before publication.