


Related Tags
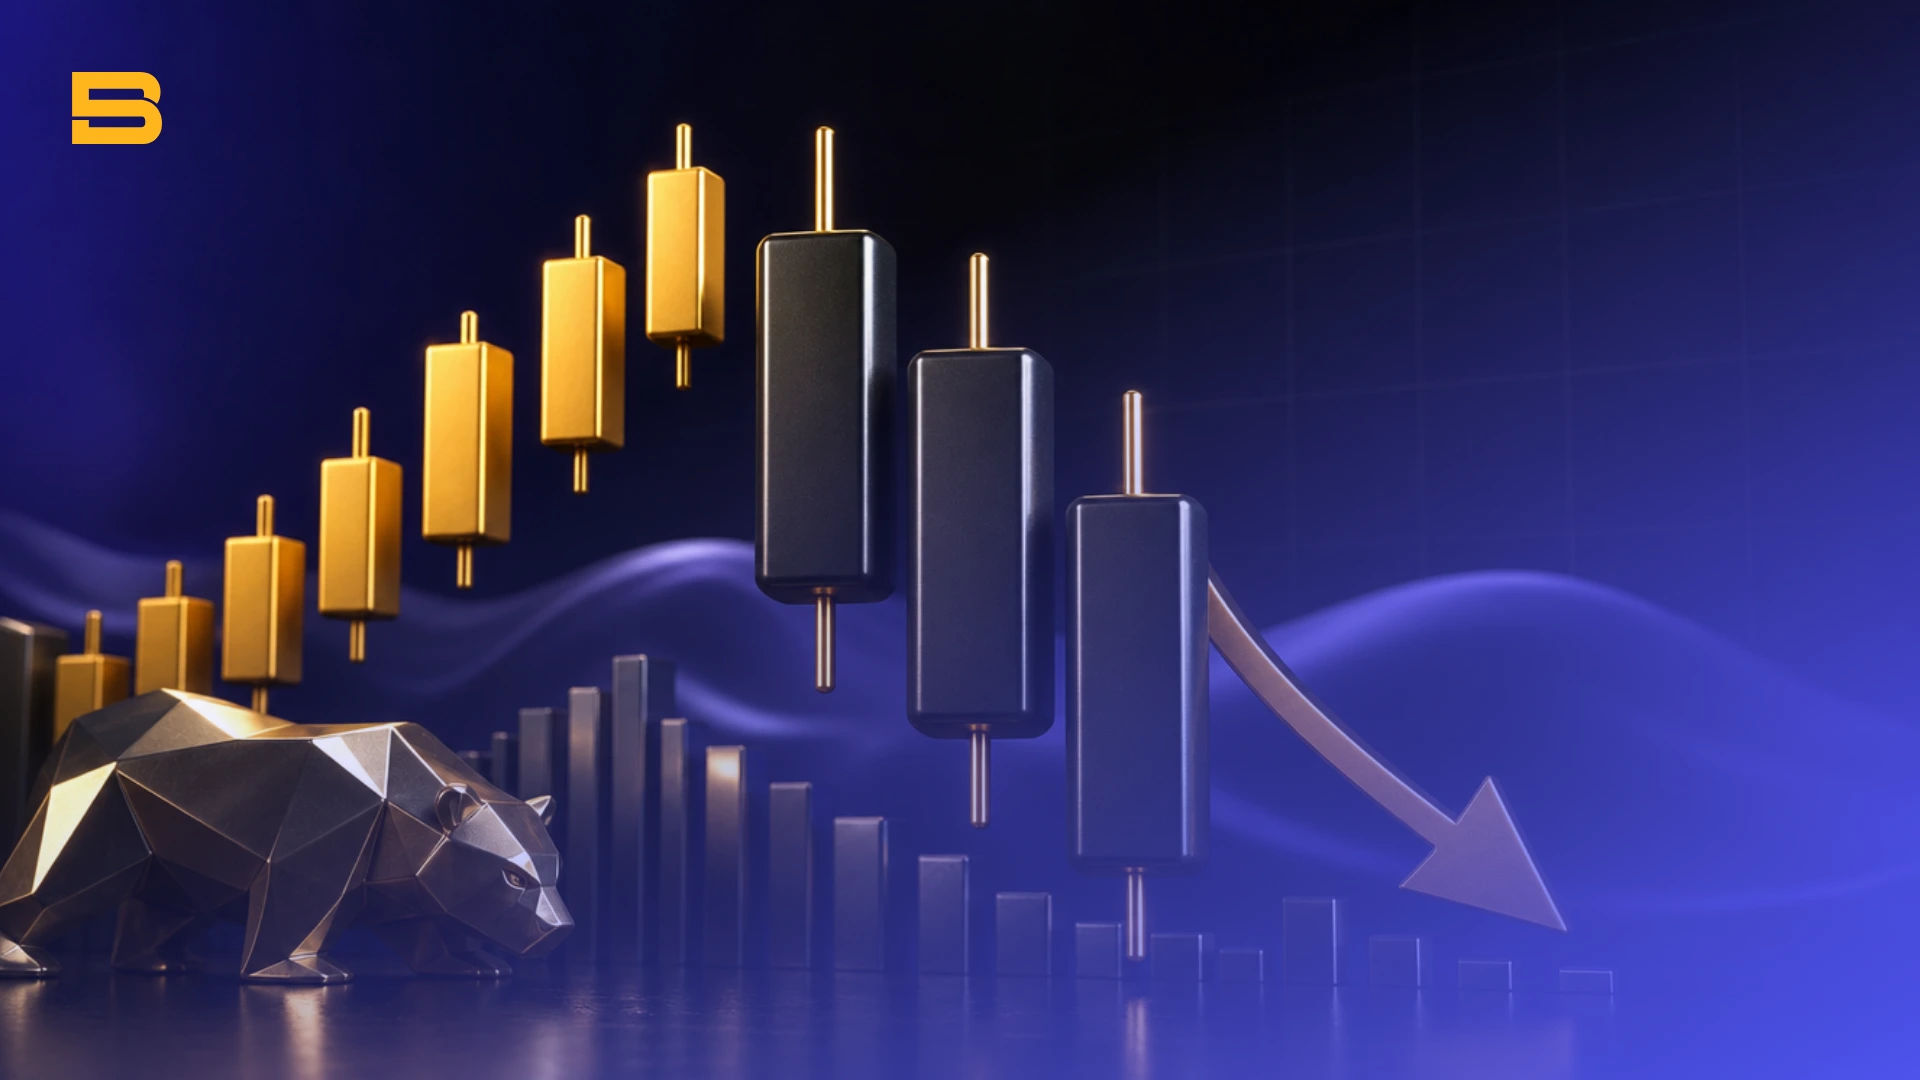
Picture watching an asset steadily climb for days, making higher highs while momentum appears strong. Suddenly, three consecutive long red candles slice through the chart, erasing weeks of buyer progress in a matter of hours. This shift is often your first visual warning that seller control has taken over, introducing a technical structure known as the three black crows candlestick pattern.
What Is the Three Black Crows Candlestick Pattern?
The three black crows candlestick pattern is a three-candle bearish reversal formation that appears at the top of an uptrend, signaling strong selling pressure.
Visually, the pattern consists of three long, consecutive bearish candles. Each candle opens within the body of the preceding candle and closes near its session low. The wicks or shadows of these candles are typically short, indicating that sellers maintained control from the market open straight through to the close.
To confirm the anatomy properly, you should look for consistent body sizes across all three session periods. If the first candle is small or resembles a doji candlestick, the pattern loses its momentum validity. Furthermore, the second and third crows should ideally push price levels below key local support established during the prior upward move.
What the Pattern Signals to Traders
When three black crows materialize after an extended bullish run, it indicates a shift in market psychology: buyers who previously dominated price action are forced to exit, while short sellers step in to drive prices lower. This transition often marks the start of a sustained bearish trend reversal.
Many technical analysts ask: is three black crows a strong bearish signal? Historically, it is considered one of the clearer visual representations of selling conviction on daily and weekly charts. Because three full sessions are consumed by relentless selling, the pattern reflects underlying institutional unwinding rather than a brief intraday fluctuation.
However, strong momentum does not mean price movements drop in a straight line forever. You must recognize that three consecutive drops can temporarily push the asset into oversold territory, making immediate entries risky without secondary confirmation.
Confluence Tools: Confirming the Signal
Relying on a candlestick pattern in isolation can expose your capital to false breakouts. Professional standards, such as those emphasized by the CFA Institute, highlight the necessity of multi-factor analysis before making trade decisions. Combining chart patterns with technical indicators substantially improves signal reliability.
Volume is the primary confluence factor for three black crows. Ideally, trading volume should expand progressively across the first, second, and third candles. Rising volume validates that institutional capital is driving the sell-off, whereas declining volume suggests weak market participation and a higher risk of a trap.
Oscillators like the Relative Strength Index (RSI) provide additional context. If the pattern forms while the RSI is coming down from overbought conditions above 70, the probability of a genuine trend reversal increases. Additionally, checking whether the first crow rejected a major resistance zone on a higher timeframe adds structural backing to the bearish outlook.
How to Trade the Three Black Crows Pattern
Trading this setup requires strict entry execution and pre-calculated risk parameters. Entering too early can mean selling directly into a minor pullback, while waiting too long reduces your risk-reward potential. International regulatory guidance from bodies like the International Organization of Securities Commissions (IOSCO) underscores the critical role of disciplined risk management in retail trading.
Standard entry timing occurs right after the third candle closes, or upon a slight intraday pullback toward the third crow's midpoint. A conservative entry triggers when price breaks below the low of the third candle. Stop-loss placement belongs above the high of the first crow, protecting your account if buyers reclaim control.
Consider a worked scenario on an equity asset:
- Asset Price: Rallies to $150 before forming three black crows.
- Candle Closes: Candle 1 closes at $146, Candle 2 at $142, and Candle 3 closes at $138.
- Entry Point: Short entry triggered at $137 (just below Candle 3's low).
- Stop-Loss Placement: Placed at $151 (above Candle 1's high of $150.50).
- Risk Amount: $14 per share ($151 − $137).
- Take-Profit Target: Set at $109, aiming for a 1:2 risk-to-reward ratio.
Trading leveraged instruments like CFDs amplifies capital velocity in both directions — while a drop toward your profit target can generate significant gains, an unexpected upside reversal can trigger severe losses just as rapidly.
Common Pitfalls and When the Pattern Fails
No technical pattern delivers absolute predictability, and the three black crows formation can fail under specific market environments. One frequent trap occurs in tight, choppy trading ranges. When three red candles form inside a consolidation channel, they often represent temporary noise rather than a genuine structural reversal.
Another common pitfall is entering late after an extreme move. By the time the third crow completes, the market may be deeply stretched, triggering an oversold rebound. Traders who short at the absolute bottom of the third candle are vulnerable to getting stopped out during a temporary counter-trend bounce.
Execution costs also impact real-world results. Slippage and widening spreads during fast-moving sell-offs can cause orders to fill below your planned entry level, altering your intended risk-reward ratio. Always factor brokerage transaction fees into your trading plan before executing momentum trades.
Comparing Three Black Crows vs. Three White Soldiers
The direct structural opposite of the three black crows is the three white soldiers pattern. While three black crows signal a bearish reversal after an uptrend, three white soldiers signal a bullish reversal after a downtrend. Both patterns rely on three consecutive long-bodied candles to confirm a shift in market control.

Key Differences: Three Black Crows vs. Shooting Star Candlestick
Traders frequently compare three black crows with single-candle top reversal formations like the shooting star candlestick. A shooting star features a long upper shadow and a small real body, showing a single-session rejection of higher prices. In contrast, three black crows represent sustained selling over three full periods.
Single-candle patterns like the shooting star or an engulfing candlestick offer earlier entry points with tighter stop-loss levels, but carry higher false-signal risks. Three black crows provide stronger structural confirmation of seller dominance, though the extended move leaves less remaining room before hitting major support levels. Combining both — such as a shooting star followed by two long red candles — often reinforces the bearish breakdown.
Spotting Shifting Market Momentum
The three black crows pattern provides traders with a clear visual signal that market momentum has shifted from buyers to sellers. By combining this formation with volume validation, resistance levels, and strict risk controls, you can navigate trend reversals with greater clarity and discipline.
- How to Build an Investment Plan That Actually Works for You?
- What Is the MACD Indicator and How to Use It
- What Is a Wedge Pattern in Trading?
- What Is Ichimoku Cloud Strategy? A Complete Trading System
- Mastering Elliott Wave Theory: Rules and Trading Strategies
- News Trading: Strategies, Execution Risks, and Risk Control
- What Is an Iron Condor Options Strategy?
- Backtesting Explained: What It Is and Why It Really Matters
- Grid Trading: Mechanics, Parameters, and Risk Strategies
- What Is Breakout Trading and How Does It Work?
- Mean Reversion: Technical Strategies and Risk Frameworks
- Momentum Trading: Indicators, Strategies, and Risk Control
- Hammer Candlestick: Structure, Meaning, and Strategy
- Doji Candlestick: Types, Signals, and Trading Strategies
- What Is the Sharpe Ratio and How to Calculate It
- What Is VWAP and How Do Traders Use It?
- Trade the Ascending Triangle: A Step-by-Step Practical Guide
- What Is the Stochastic Oscillator and How to Use It
- How to Trade the Descending Triangle Pattern
- High Frequency Trading: Speed, Algorithms, and Market Impact
- What Is Volume Profile and How to Use It in Trading
- What Is a Morning Star Pattern Candlestick?
- Trade with Parabolic SAR: A Practical Analysis Guide
- Evening Star Pattern: Structure, Rules, and Risk Controls
- Kelly Criterion: Formula, Position Sizing, and Risk
- What Is the NYSE Minimum Trading Price? Rules Explained
Disclaimer: The content on this page is intended for educational and informational purposes only. It does not constitute financial, investment, tax, or legal advice, and should not be interpreted as a recommendation to buy, sell, or hold any financial instrument or asset. Trading and investing involve significant risk, including the possible loss of your entire capital. Products such as forex, CFDs, and cryptocurrencies carry additional risks due to leverage, high volatility, and limited regulatory protection in some jurisdictions. Past performance of any financial instrument does not guarantee future results. Any market views, forecasts, or opinions expressed are those of the author at the time of writing and may not reflect current market conditions. Platform features, fees, and regulatory status are subject to change — always verify information directly with the relevant provider or regulator before making any financial decision. BrokerSpecs may receive compensation from third parties featured on this site. Always conduct your own due diligence and consider seeking advice from a licensed financial professional before investing. Portions of this article were prepared with the assistance of AI tools and reviewed by our editorial team before publication.