



Related Tags
You are tracking a stock that has already climbed 15% over three weeks, waiting patiently for a pullback to enter. Instead of dipping, it closes near its daily high on Thursday, and when the opening bell rings on Friday, the price jumps 4% higher without trading a single share in between. That blank space on your chart is a runaway gap, a mid-trend price jump that signals accelerating momentum, though chasing it blindly exposes you to sudden reversals and execution slippage.
What Is a Runaway Gap in Trading?
A runaway gap is an unfilled price void occurring midway through an established trend, signaling strong momentum and potential trend continuation. Unlike early breakout moves, this formation appears after a directional trend is already underway and reflects a sudden surge in market urgency.
Traders who sat on the sidelines during the initial leg often realize they are missing a major move and rush to enter simultaneously. In an uptrend, aggressive buy orders overwhelm available sellers overnight or between sessions, forcing the market to open sharply higher. In a downtrend, panic selling creates the opposite effect, leaving an empty downward void as buyers step back.
Because this pattern relies on sustained directional conviction rather than initial base breakouts, it stands apart from standard chart patterns that form during consolidation. Recognizing whether a price jump represents genuine mid-trend acceleration or late-stage exhaustion helps you decide whether to stay with a trend or tighten your risk controls.
How to Identify a Runaway Gap on a Price Chart
Spotting a valid price gap requires checking four technical conditions rather than reacting to every space on a candlestick chart. A single isolated price jump without supporting context can easily trap you on the wrong side of a short-term reversal.
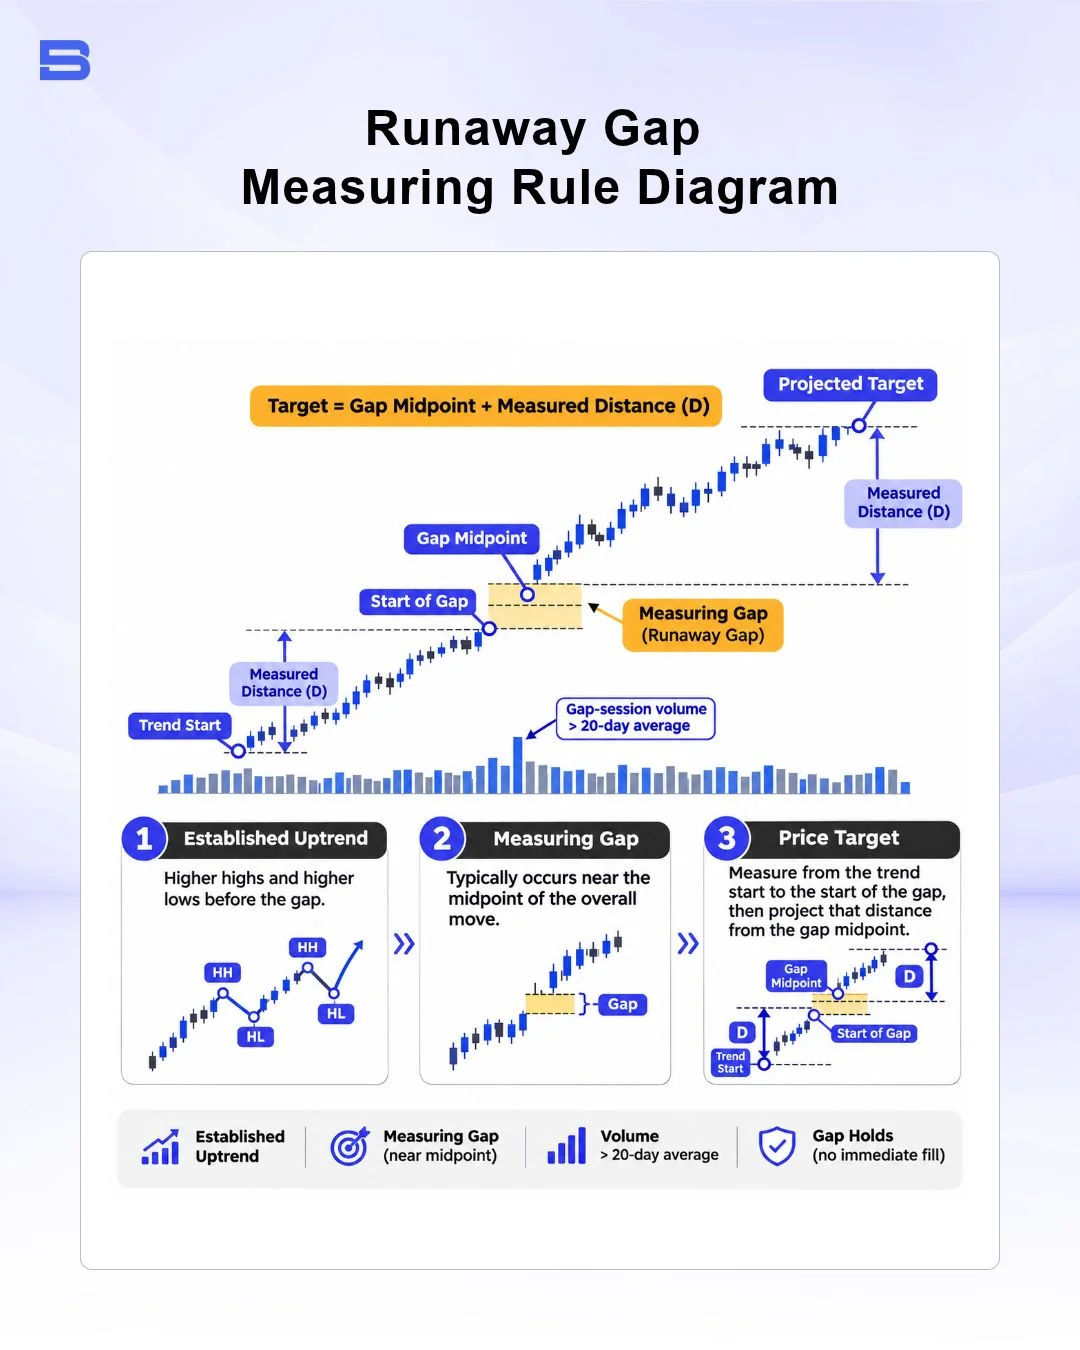
- An established prior trend: Price must already show a clear sequence of higher highs and higher lows in an uptrend, or lower highs and lower lows in a downtrend, before the gap forms.
- Midpoint trend placement: Runaway gaps typically appear around the midpoint of an established directional move, which is why they are also known as measuring gaps.
- Above-average volume confirmation: Look for gap-session trading volume that exceeds the recent 20-day average. Above-average volume can indicate stronger market participation and provide additional confirmation of the price movement, although it does not independently identify institutional activity or guarantee continuation.
- Absence of immediate gap fill: In a true continuation move, price holds above the upper edge of a bullish gap (or below the lower edge of a bearish gap) over the next several sessions instead of quickly retracing to close the void.
Evaluating all four criteria together filters out random overnight noise from meaningful trend acceleration.
How Runaway Gaps Differ in Stocks vs. Forex and CFDs
Centralized stock exchanges like Bursa Malaysia or the New York Stock Exchange close overnight, creating frequent daily gaps when earnings reports or macroeconomic news hit after hours. Because order books reset before the next morning’s opening auction, genuine mid-trend price gaps appear regularly on daily equity charts.
By contrast, spot forex trades 24 hours a day, five days a week, and many index CFDs follow their underlying futures hours with short daily breaks, so large mid-week gaps are less common outside major central bank surprises. Instead, gaps in these markets usually happen over the weekend between Friday’s close and Sunday’s open, where high leverage magnifies both potential gains and rapid losses if price gaps past your stop level.
Runaway Gap vs. Breakaway and Exhaustion Gaps
Misreading where a gap sits inside a broader price cycle is one of the fastest ways to enter at the exact top or bottom of a move.
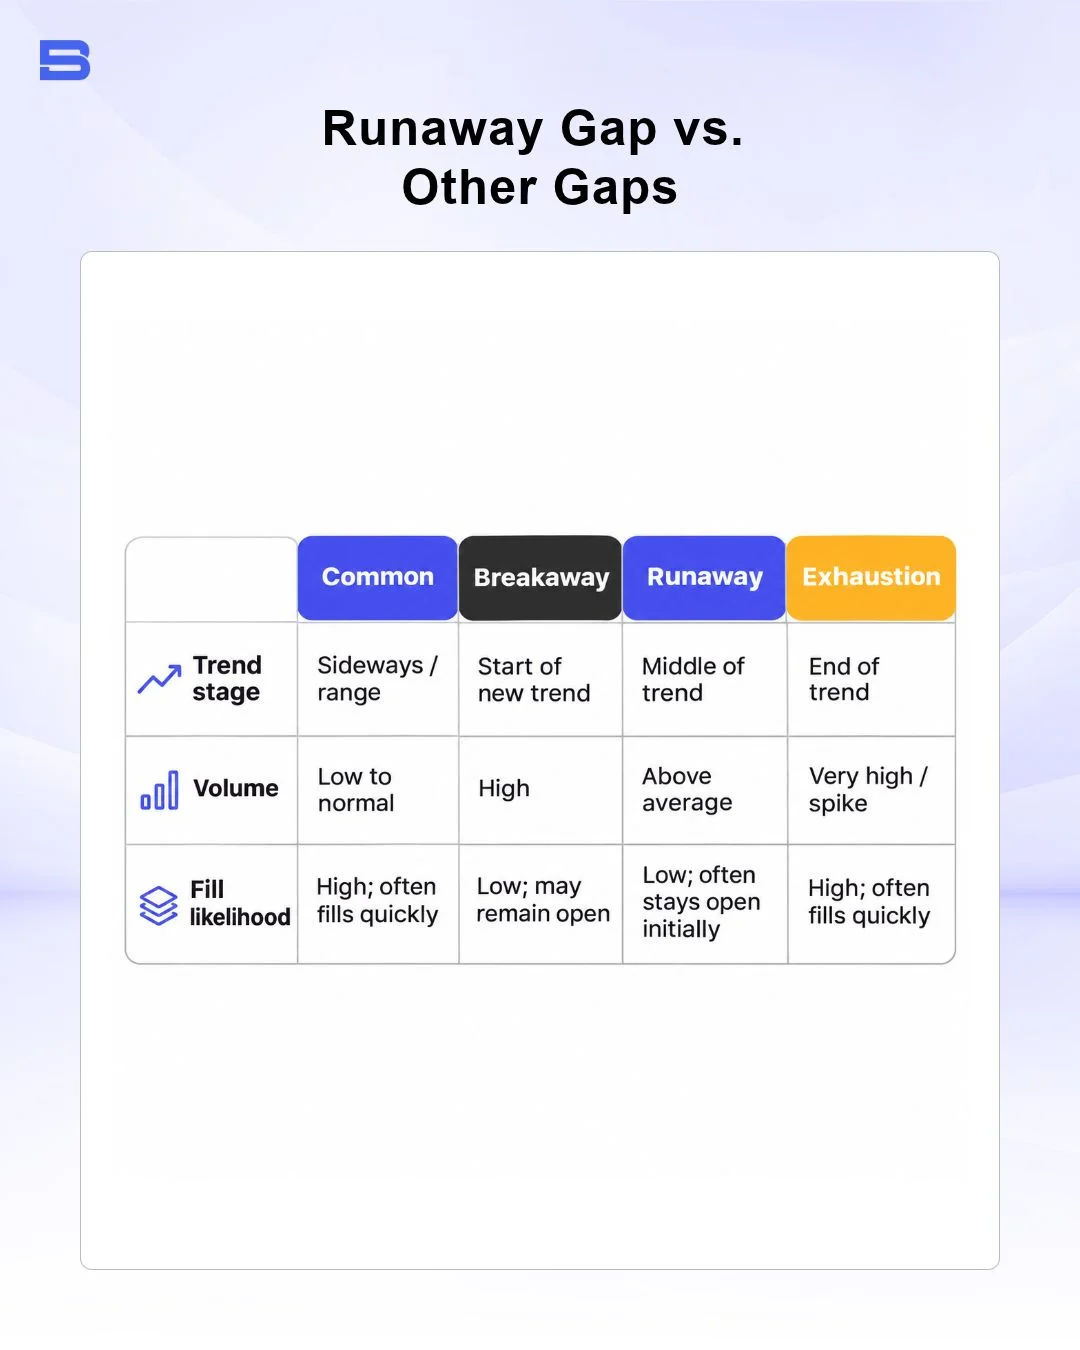
A breakaway gap occurs right at the start of a new trend as price escapes a multi-week trading range or consolidation zone on heavy volume. A runaway gap follows later once that trend is already established, confirming that momentum remains intact.
By contrast, an exhaustion gap appears near the very end of an extended rally or sell-off, often accompanied by climactic, unusually high volume as latecomers rush in just before smart money (larger, often institutional traders) exits. If price gaps up at the end of a long rally and then gaps back down a few days later, it forms an island reversal pattern that frequently precedes a sharp trend reversal.
Worked Example: Measuring Price Targets and Managing Risk
Suppose a mid-cap stock breaks out of a base at $40.00 and climbs steadily over two weeks to close at $50.00 on Wednesday. Before Thursday’s open, the company announces a major supply contract, and the stock opens at $52.50 on twice its 20-day average volume, leaving a $2.50 price gap between $50.00 and $52.50.
To evaluate the potential trade, you can map out both the theoretical upside projection and the realistic downside execution risk:
- Calculate the prior trend distance: Subtract the trend origin ($40.00) from the pre-gap close ($50.00), giving a $10.00 initial move.
- Project the continuation target: Add that $10.00 distance to the midpoint of the gap ($51.25), yielding a technical upside estimate of $61.25.
- Define the invalidation level: Place a protective stop-loss order just below the gap floor at $49.50, risking $3.00 per share from a $52.50 entry.
However, technical projections never guarantee a smooth ride, and adverse news can turn a continuation setup into a sharp reversal. As the US Securities and Exchange Commission (SEC) highlights in its investor alerts on order execution, a standard stop-loss becomes a market order once triggered and does not protect against overnight gap slippage. If negative news hits after hours and the stock opens at $47.00 instead of $49.50, your actual loss widens from $3.00 per share to $5.50 per share, nearly doubling your planned risk.
Using the Measuring Gap Rule to Estimate Price Targets
The measuring gap rule assumes that price gaps form near the halfway point of a sustained directional move. You take the vertical price distance from the start of the trend to the start of the gap, then project that same distance forward from the gap’s midpoint.
Treat this target as a rough zone for scaling out of positions rather than an exact ceiling. Broader market liquidity, sector rotation, and macroeconomic data can stall a trend well before it reaches its theoretical projection.
Conclusion
A runaway gap serves as a practical mid-trend confirmation signal, helping you gauge whether an existing move still has enough momentum to continue and estimate potential target zones. At the same time, high-momentum gaps carry elevated reversal and slippage risks, so pairing technical analysis with disciplined position sizing and realistic stop-loss planning remains essential.
- How to Build an Investment Plan That Actually Works for You?
- What Is the MACD Indicator and How to Use It
- What Is a Wedge Pattern in Trading?
- What Is Ichimoku Cloud Strategy? A Complete Trading System
- Mastering Elliott Wave Theory: Rules and Trading Strategies
- News Trading: Strategies, Execution Risks, and Risk Control
- What Is an Iron Condor Options Strategy?
- Backtesting Explained: What It Is and Why It Really Matters
- Grid Trading: Mechanics, Parameters, and Risk Strategies
- What Is Breakout Trading and How Does It Work?
- Mean Reversion: Technical Strategies and Risk Frameworks
- Momentum Trading: Indicators, Strategies, and Risk Control
- Hammer Candlestick: Structure, Meaning, and Strategy
- Doji Candlestick: Types, Signals, and Trading Strategies
- What Is the Sharpe Ratio and How to Calculate It
- What Is VWAP and How Do Traders Use It?
- Trade the Ascending Triangle: A Step-by-Step Practical Guide
- What Is the Stochastic Oscillator and How to Use It
- How to Trade the Descending Triangle Pattern
- High Frequency Trading: Speed, Algorithms, and Market Impact
- What Is Volume Profile and How to Use It in Trading
- What Is a Morning Star Pattern Candlestick?
- Trade with Parabolic SAR: A Practical Analysis Guide
- Evening Star Pattern: Structure, Rules, and Risk Controls
- Kelly Criterion: Formula, Position Sizing, and Risk
- What Is the NYSE Minimum Trading Price? Rules Explained
Disclaimer: The content on this page is intended for educational and informational purposes only. It does not constitute financial, investment, tax, or legal advice, and should not be interpreted as a recommendation to buy, sell, or hold any financial instrument or asset. Trading and investing involve significant risk, including the possible loss of your entire capital. Products such as forex, CFDs, and cryptocurrencies carry additional risks due to leverage, high volatility, and limited regulatory protection in some jurisdictions. Past performance of any financial instrument does not guarantee future results. Any market views, forecasts, or opinions expressed are those of the author at the time of writing and may not reflect current market conditions. Platform features, fees, and regulatory status are subject to change — always verify information directly with the relevant provider or regulator before making any financial decision. BrokerSpecs may receive compensation from third parties featured on this site. Always conduct your own due diligence and consider seeking advice from a licensed financial professional before investing. Portions of this article were prepared with the assistance of AI tools and reviewed by our editorial team before publication.