



Related Tags
You are watching a currency pair or stock slide steadily lower for weeks, printing lower lows that look grim at first glance. Yet each new drop travels a shorter distance than the last, and sellers struggle to push prices meaningfully below support. That compression is the signature footprint of a falling wedge, a classic chart pattern that often signals fading bearish pressure before an upside breakout.
What Is a Falling Wedge Chart Pattern and How Does It Form?
A falling wedge chart pattern is a bullish technical formation bounded by two downward-sloping, converging trendlines that connect lower highs and lower lows. Unlike a parallel downward channel, the upper resistance line falls at a steeper angle than the lower support line, squeezing price action into an increasingly narrow apex.
This geometric narrowing reflects a gradual shift in order flow from aggressive selling to seller exhaustion. While bears still manage to push prices slightly lower on each swing, buyers step in earlier at higher relative levels, compressing the range until a breakout resolves the tension.
To draw a valid descending wedge, you need at least four distinct touchpoints, typically two lower highs along resistance and two lower lows along support. Placing a proper trendline across natural swing wicks rather than forcing lines through candle bodies prevents you from seeing patterns that are not actually there.
Trading volume generally contracts as the wedge narrows, confirming that selling conviction is drying up rather than accelerating. According to technical analysis principles outlined by the CFA Institute, genuine price breakouts carry greater validity when accompanied by a noticeable expansion in volume as price clears resistance.
Is a Falling Wedge Pattern Bullish or Bearish? Reversal vs. Continuation
A falling wedge is structurally a bullish pattern, though its reliability and risk profile depend heavily on the broader trend preceding it. Understanding whether the setup is acting as a reversal or a continuation signal helps you size your risk appropriately.
When a falling wedge pattern forms at the bottom of an extended downtrend, it acts as a bullish reversal signal. Here, you are trading against the prevailing macro momentum, which carries higher whipsaw risk because entrenched sellers may defend overhead resistance on the first bounce.
When the same formation develops as a temporary pullback inside an established uptrend, it functions as a bullish continuation pattern. In this context, the wedge often reflects routine profit-taking before the primary upward trend may resume, and it generally offers higher-probability follow-through than counter-trend bottom fishing (buying in an attempt to catch the lowest point of a downtrend).
By contrast, its mirror image, the rising wedge pattern, slopes upward and signals buyer exhaustion, which typically points to a bearish move rather than a bullish recovery. Similarly, traders looking for broader topping structures at market peaks often pair trendline analysis with formations like a double top chart pattern to confirm when an uptrend is rolling over.
Falling Wedge vs. Descending Triangle and Bull Flag: Key Differences
Visual similarities often cause traders to confuse a falling wedge with a descending triangle or a bull flag, leading to misaligned directional bias. Comparing the slope of both boundary lines and the behavior of volume separates these three structures cleanly.
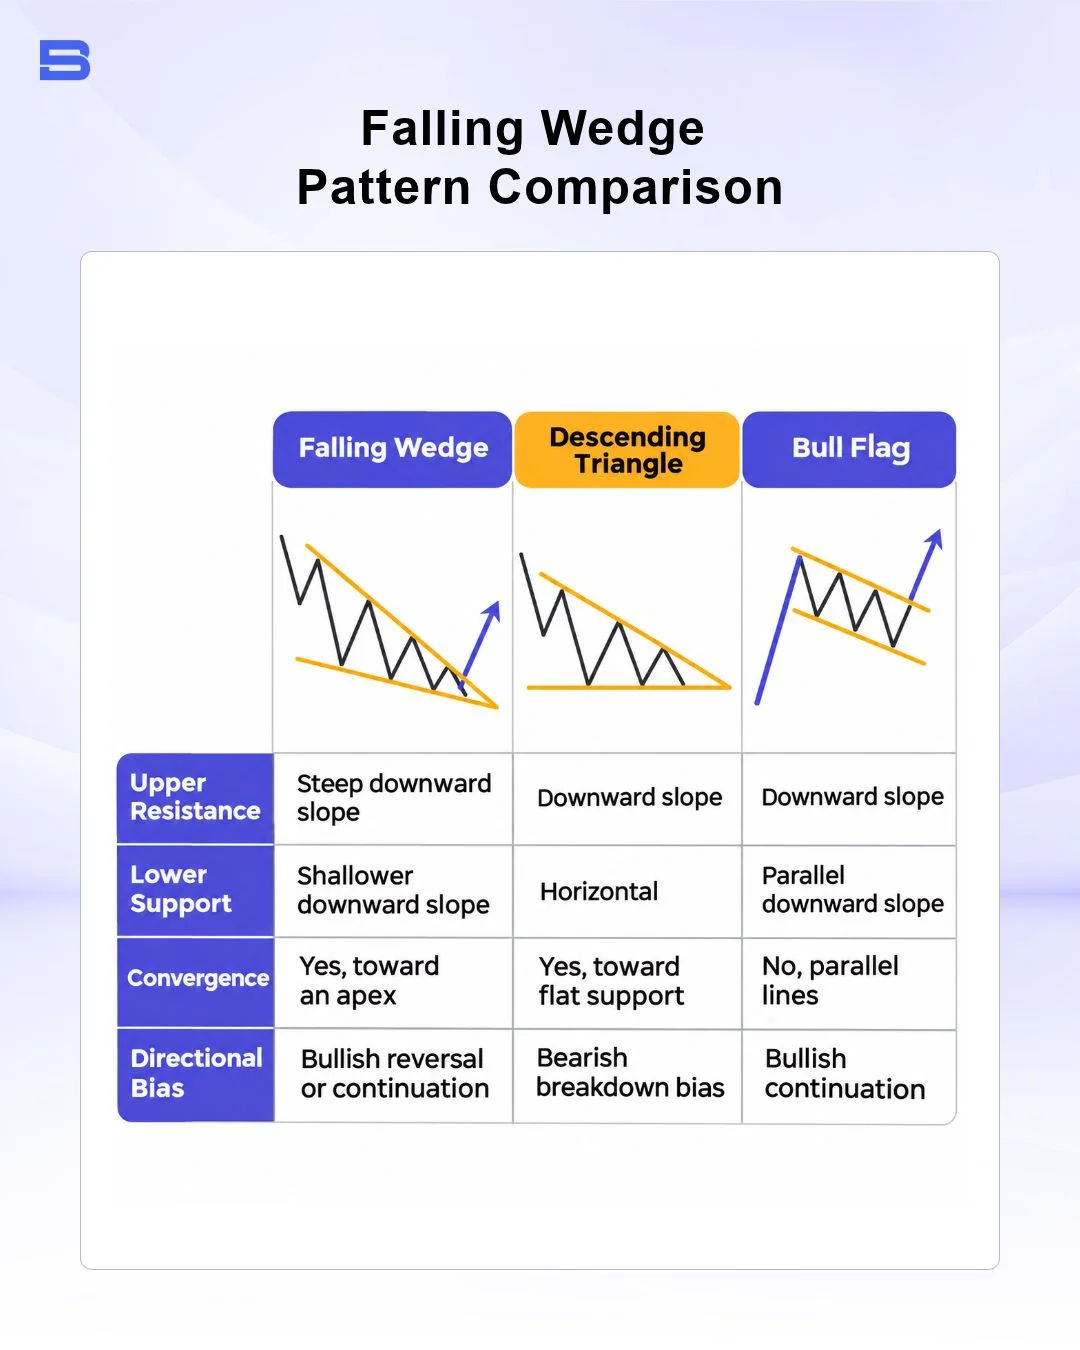
The critical distinction with a descending triangle is its flat horizontal support floor, which shows buyers defending one static price level while sellers press lower highs against it. If you misread a descending triangle as a falling wedge, you risk buying right before support breaks down. A bull flag, by contrast, keeps two parallel boundaries, much like a descending channel pattern, rather than converging like a falling wedge or a triangle chart pattern.
How to Trade Falling Wedge Pattern Setups Step by Step
Trading a falling wedge effectively requires waiting for price to prove that buyers have regained control rather than guessing the bottom inside the wedge. Once the pattern has at least four touches and approaches roughly two-thirds to three-quarters of its length toward the apex, you can prepare a structured execution plan.
Suppose EUR/USD forms a falling wedge on the 4-hour chart between a wide base of 1.0950 and 1.0850 (a 100-pip height) and narrows down to resistance at 1.0840 and a final swing low at 1.0800. You enter long on a confirmed breakout close at 1.0845, place your stop-loss 10 pips below the swing low at 1.0790 (55 pips of risk), and project the 100-pip wedge height from the 1.0840 breakout to target 1.0940 (95 pips of potential reward, a 1:1.73 risk-reward ratio before trading costs). Spreads, commissions, and overnight swap fees reduce that net reward, so include them in your calculation before you enter.
If you hesitate and chase the breakout late at 1.0885 while keeping the same stop at 1.0790, your risk balloons to 95 pips while your remaining upside to 1.0940 shrinks to 55 pips, flipping your risk-reward ratio to an unfavorable 1:0.58. When trading leveraged CFDs or forex pairs, that degraded ratio becomes even more dangerous because leverage magnifies both gains and losses simultaneously. A 2% adverse move on a 30:1 leveraged position can wipe out 60% of your posted margin, a hazard highlighted in retail derivatives guidance from the International Organization of Securities Commissions (IOSCO).
Confirming Breakouts with Volume and RSI Divergence
Before committing capital, look for a decisive candlestick close above the upper resistance trendline accompanied by a clear spike in trading volume. Pairing that breakout with bullish Relative Strength Index (RSI) divergence, where price prints a lower low inside the wedge while the RSI prints a higher low, adds evidence that downward momentum has genuinely stalled.
Breakout Entry vs. Retest Entry
Entering immediately on the breakout candle close can help you catch a fast momentum surge, though it exposes you to false breakouts that snap back inside the wedge. Waiting for price to pull back and retest the broken upper trendline as new support improves your entry price and risk-reward ratio, at the cost of missing trades that rally without looking back.
Setting Stop-Loss and Measured Move Profit Targets
Place your stop-loss just beneath the lowest swing low inside the wedge, giving the setup room to breathe while invalidating the trade if sellers regain control. To estimate a measured move profit target, measure the vertical distance between the highest high and lowest low at the widest part of the wedge and project that exact distance upward from the breakout point.
Common Falling Wedge Failure Modes and Risk Management
No chart pattern works in isolation, and falling wedges fail regularly when traders force trendlines onto noisy consolidation or ignore higher-timeframe downtrends. When price pokes briefly above resistance on weak volume and reverses sharply lower, buyers are caught in a bull trap that triggers cascading stop-loss orders.
Conversely, price can briefly dip below the lower support line to sweep retail stop-losses before snapping back upward through resistance in a classic bear trap. In steep macro bear markets, a minor upside break from a small wedge often turns out to be a temporary dead cat bounce that fails at major higher-timeframe resistance.
Data disclosed by UK-regulated brokers shows that a substantial proportion of retail investor accounts lose money when trading leveraged CFDs. In December 2022, the Financial Conduct Authority (FCA) reported that approximately 80% of customers lose money when investing in CFDs, while requiring individual providers to display their own up-to-date loss percentages in standardized risk warnings. Capping your position size so that a single stopped-out wedge costs no more than 1% to 2% of your account equity can help keep inevitable false breakouts manageable.
Key Takeaways for Trading the Falling Wedge Pattern
A falling wedge pattern gives you a structured way to spot fading downward momentum, provided you distinguish between counter-trend reversals and higher-probability uptrend continuations. Waiting for a volume-backed close above resistance and respecting strict position sizing can help limit the damage to your capital when an apparent breakout fails.
- How to Build an Investment Plan That Actually Works for You?
- What Is the MACD Indicator and How to Use It
- What Is a Wedge Pattern in Trading?
- What Is Ichimoku Cloud Strategy? A Complete Trading System
- Mastering Elliott Wave Theory: Rules and Trading Strategies
- News Trading: Strategies, Execution Risks, and Risk Control
- What Is an Iron Condor Options Strategy?
- Backtesting Explained: What It Is and Why It Really Matters
- Grid Trading: Mechanics, Parameters, and Risk Strategies
- What Is Breakout Trading and How Does It Work?
- Mean Reversion: Technical Strategies and Risk Frameworks
- Momentum Trading: Indicators, Strategies, and Risk Control
- Hammer Candlestick: Structure, Meaning, and Strategy
- Doji Candlestick: Types, Signals, and Trading Strategies
- What Is the Sharpe Ratio and How to Calculate It
- What Is VWAP and How Do Traders Use It?
- Trade the Ascending Triangle: A Step-by-Step Practical Guide
- What Is the Stochastic Oscillator and How to Use It
- How to Trade the Descending Triangle Pattern
- High Frequency Trading: Speed, Algorithms, and Market Impact
- What Is Volume Profile and How to Use It in Trading
- What Is a Morning Star Pattern Candlestick?
- Trade with Parabolic SAR: A Practical Analysis Guide
- Evening Star Pattern: Structure, Rules, and Risk Controls
- Kelly Criterion: Formula, Position Sizing, and Risk
- What Is the NYSE Minimum Trading Price? Rules Explained
Disclaimer: The content on this page is intended for educational and informational purposes only. It does not constitute financial, investment, tax, or legal advice, and should not be interpreted as a recommendation to buy, sell, or hold any financial instrument or asset. Trading and investing involve significant risk, including the possible loss of your entire capital. Products such as forex, CFDs, and cryptocurrencies carry additional risks due to leverage, high volatility, and limited regulatory protection in some jurisdictions. Past performance of any financial instrument does not guarantee future results. Any market views, forecasts, or opinions expressed are those of the author at the time of writing and may not reflect current market conditions. Platform features, fees, and regulatory status are subject to change — always verify information directly with the relevant provider or regulator before making any financial decision. BrokerSpecs may receive compensation from third parties featured on this site. Always conduct your own due diligence and consider seeking advice from a licensed financial professional before investing. Portions of this article were prepared with the assistance of AI tools and reviewed by our editorial team before publication.