


Related Tags
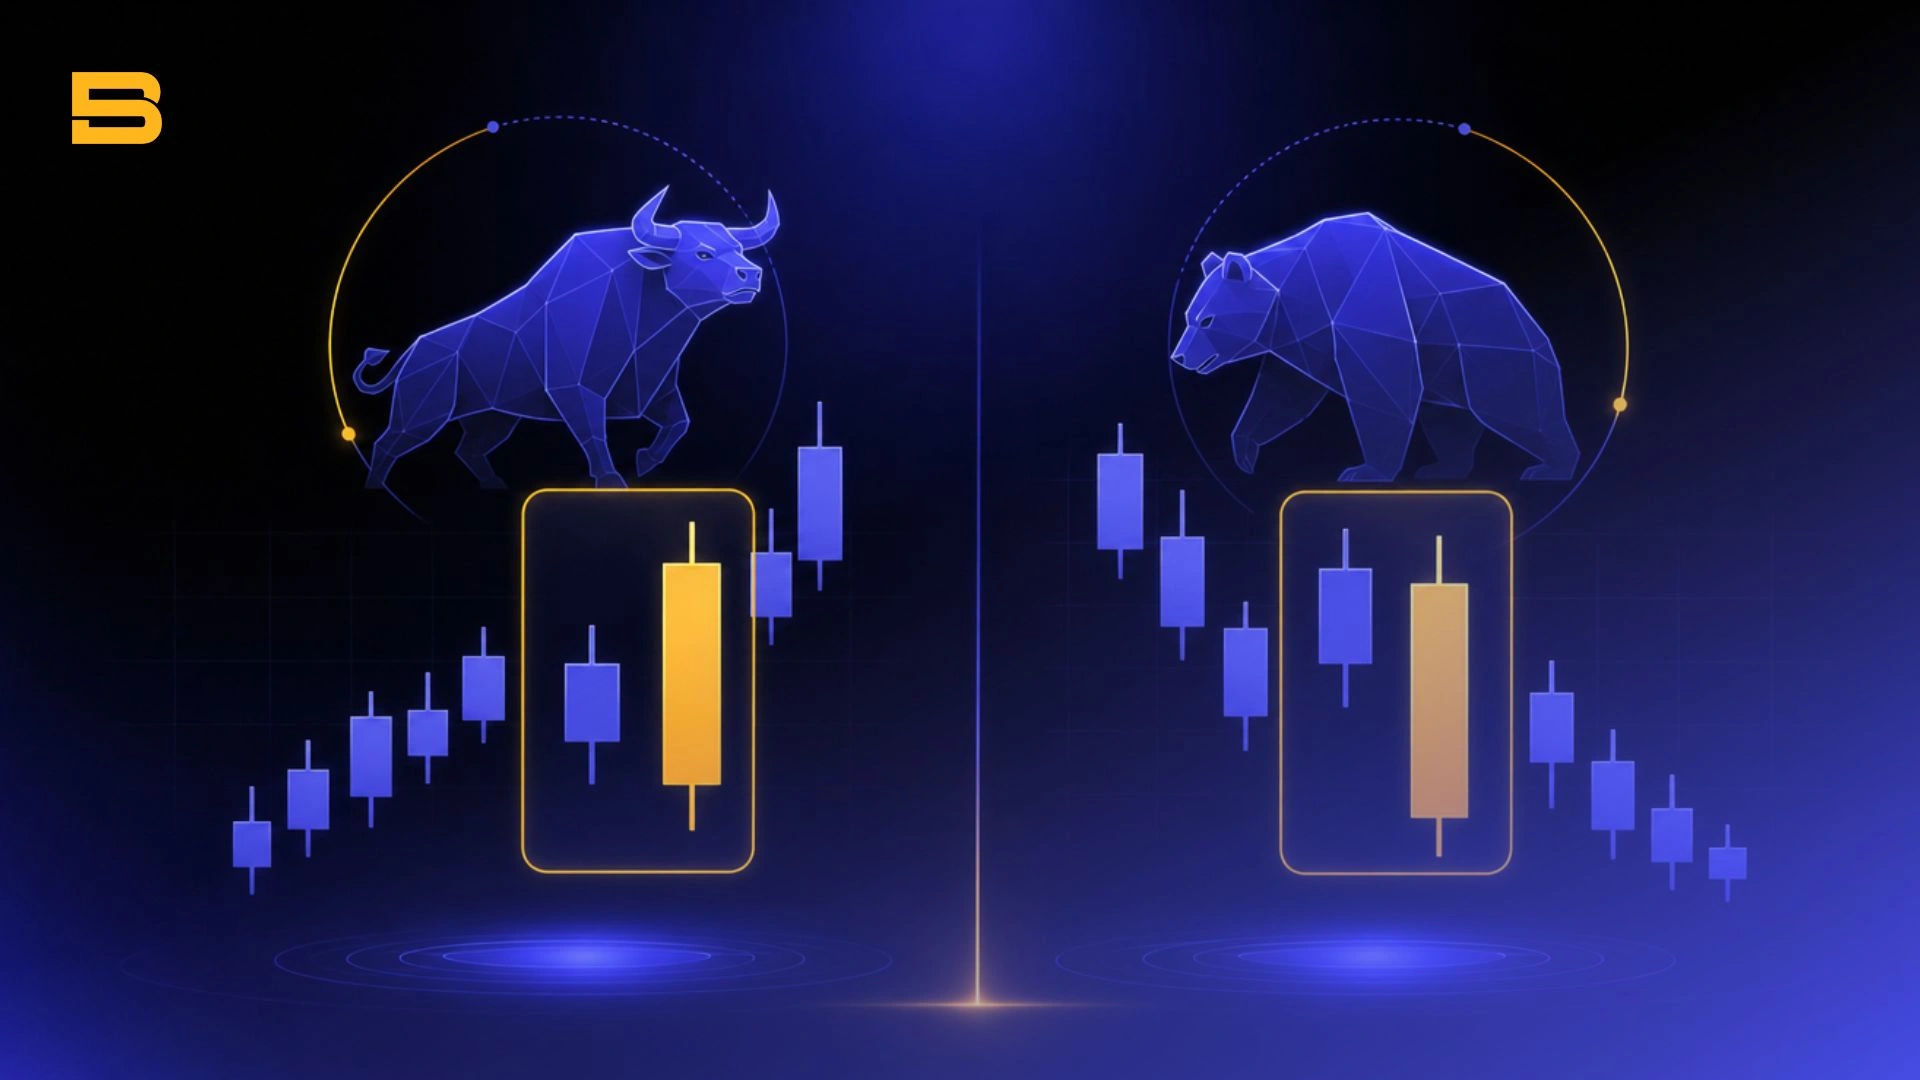
You are watching a routine market pullback, where small downward candles suggest the prevailing trend will continue uninterrupted. Suddenly, a large green candle forms, fully covering the body of the previous candle in a single session and completely altering the market landscape.
This shift in price action is known as an engulfing pattern. Technical analysts and price action traders rely on this two-candle formation to identify high-probability momentum shifts and potential trend reversals across various financial markets.
Understanding the Engulfing Pattern and Its Market Mechanics
At its core, an engulfing pattern is a visual representation of a sudden, decisive shift in market sentiment. The pattern consists of two consecutive candles where the body of the second candle completely overlaps or "engulfs" the real body of the first candle.
When evaluating these formations, it is essential to look beyond the visual shape and understand the underlying order flow. The initial, smaller candle represents weakening momentum or exhaustion from the dominant side. The subsequent, larger candle demonstrates an aggressive influx of opposing orders that absorbs all existing liquidity and drives price past the previous session's open.
Real-Body vs. Full-Range Engulfing: Do Wicks Matter?
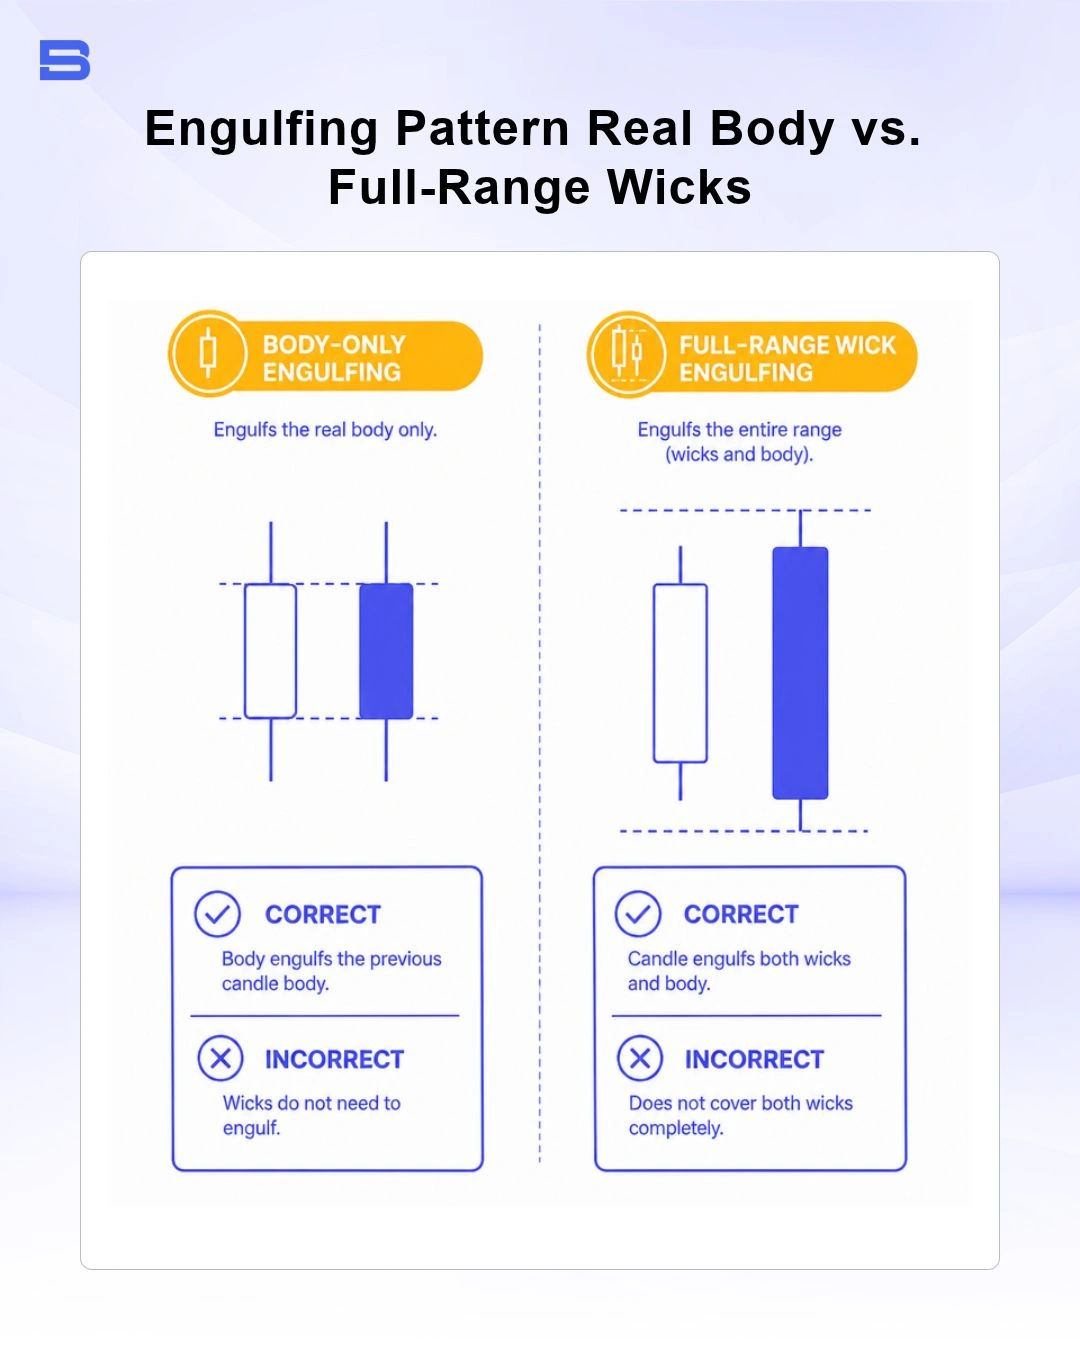
A common point of confusion among technical traders is whether the second candle must engulf the previous candle's upper and lower wicks, or just its real body. Standard price action theory dictates that a valid engulfing pattern requires only the real body—the range between the opening and closing prices—of the second candle to fully cover the real body of the first.
However, a full-range engulfing formation, where the second candle's body engulfs both the body and the high/low wicks of the first candle, represents a significantly stronger momentum shift. While real-body engulfing patterns occur more frequently, full-range wick engulfing signals offer higher structural reliability because they demonstrate complete control from the opening bell to market close.
How Market Structure Changes Engulfing Formations (Stocks vs. 24-Hour FX/Crypto)
The physical appearance of the pattern varies depending on the underlying market structure. In traditional stock markets that operate on fixed trading hours, prices frequently gap open above or below the previous session's close. A classic stock market bullish engulfing candle often gaps down below the previous close before buyers drive the price higher, creating an unmistakable visual overlap.
In continuous 24-hour markets like foreign exchange (forex) and cryptocurrencies, price gaps are exceptionally rare outside of weekend opens. Consequently, the opening price of the second candle is almost always identical to the closing price of the first candle. In 24-hour markets, a valid engulfing pattern simply requires the second candle's body to extend past the first candle's opening price, establishing a contiguous structural shift.
Bullish Engulfing vs. Bearish Engulfing: Key Differences
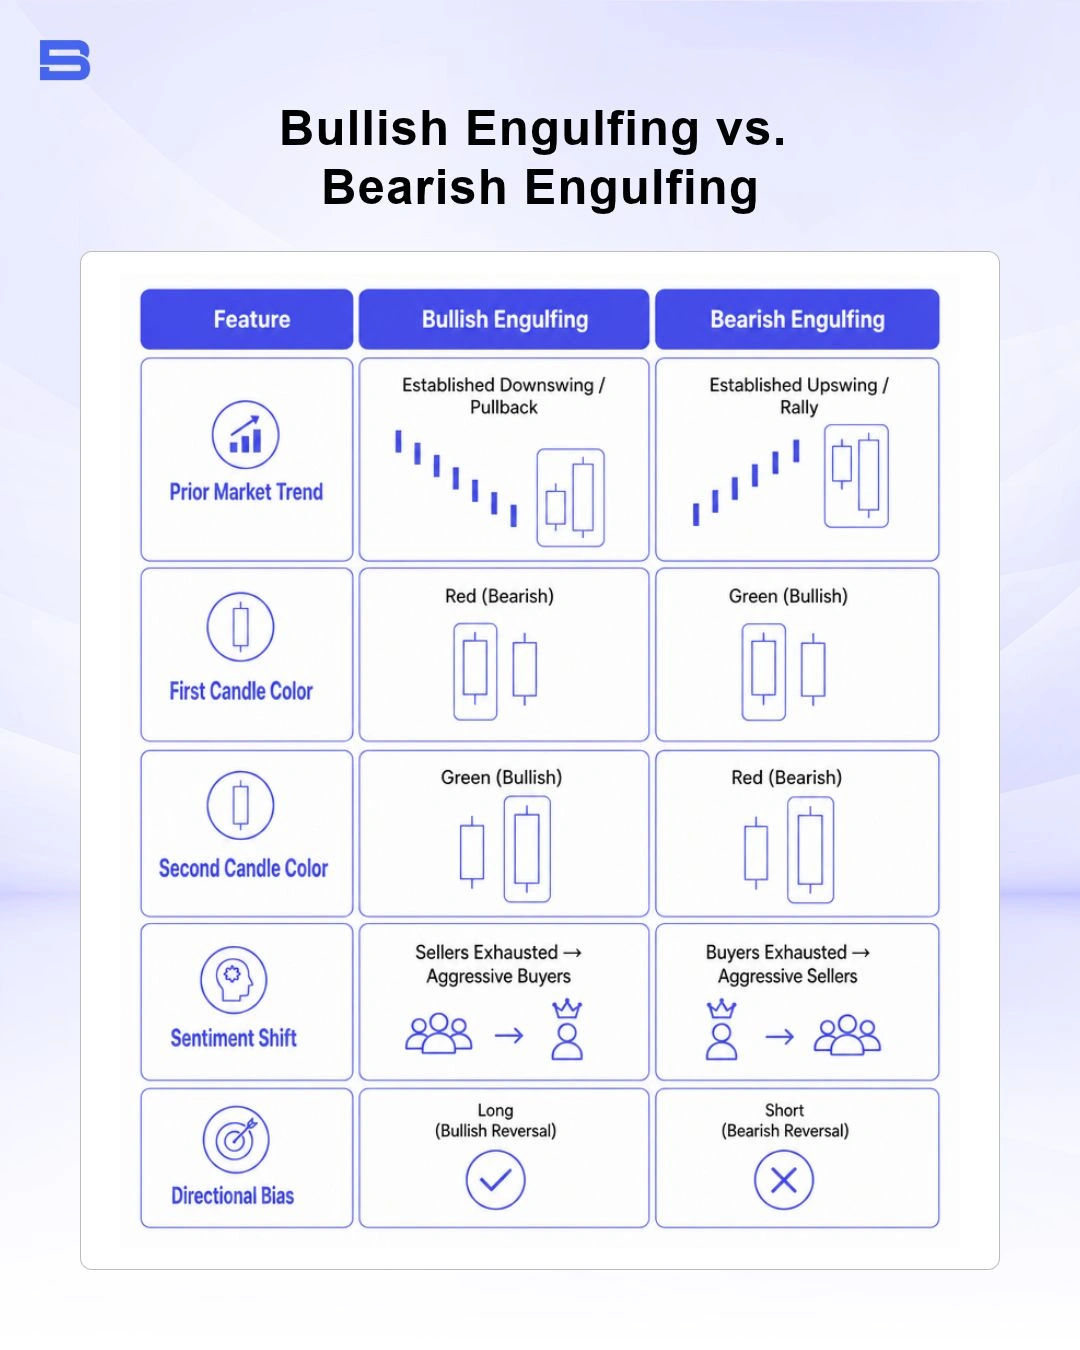
While both variations signal potential market reversals, their structural context, directional bias, and trading implications are opposite.
What Is a Bullish Engulfing Pattern?
It forms at the trough of a downtrend or at a key support zone during a market pullback. It begins with a small bearish red candle, followed by a large bullish green candle whose body completely covers the preceding red body. This shift signals that sellers have lost control and aggressive buying pressure has entered the market, setting up potential long opportunities.
What Is a Bearish Engulfing Pattern?
It occurs at the crest of an uptrend at the crest of an uptrend or near an established resistance barrier. The first candle is a small bullish green candle, followed immediately by a large bearish red candle that completely engulfs the green body. This visual signal indicates that buying demand has dried up and institutional selling pressure has taken charge, signaling potential short setups.
How to Trade the Engulfing Pattern with Risk Controls
Trading engulfing patterns purely in isolation can lead to false breakouts and unnecessary losses. To maximize consistency, you must trade them at critical technical levels—such as major support/resistance, Fibonacci retracement levels (price zones based on prior swing highs/lows), or dynamic moving averages (trend lines that adjust with price)—while strictly defining your risk parameters.
You have two primary entry methods when a valid engulfing candle completes:
- Market Entry on Close: Enter immediately upon the close of the second (engulfing) candle. This ensures you catch the initial momentum move, though it may result in a wider stop loss.
- Breakout Entry: Place a stop order just beyond the high (for bullish setups) or low (for bearish setups) of the engulfing candle. This requires price to confirm further momentum before triggering your trade.
Worked Trading Scenario
Consider a stock trading setup where a stock has been retracing down to a primary support level at $50.00:
- Pattern Formation: Candle 1 closes bearish at $49.50. Candle 2 opens at $49.50 and aggressively rallies to close at $52.00, fully engulfing Candle 1.
- Entry Execution: You enter a long position at the candle close of $52.00.
- Stop Loss Placement: Placed just below the low of the engulfing candle at $48.50 (Risk = $3.50 per share).
- Take Profit Target: Set at a key resistance level of $59.00 (Reward = $7.00 per share).
- Outcome: This structure sets up a 1:2 Risk-to-Reward ratio, risking $3.50 to make $7.00. Note: This is a hypothetical example for illustration only — actual trade outcomes depend on live market conditions and are never guaranteed.
Managing Risk with ATR Buffers
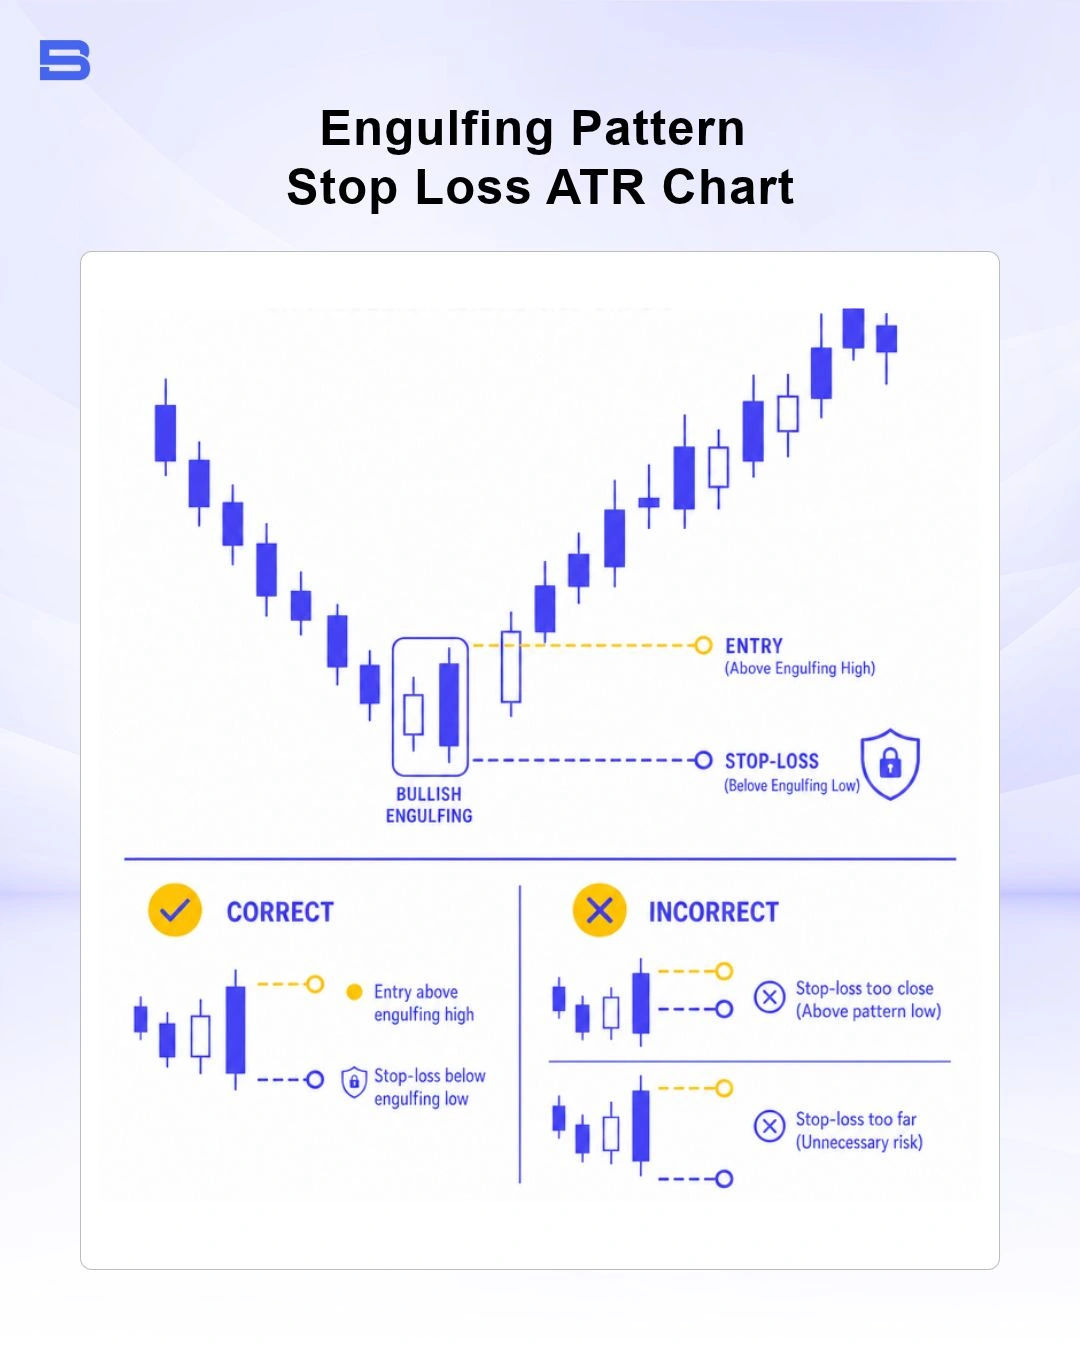
Placing a stop loss directly at the high or low wick of an engulfing candle often exposes your position to market noise and stop-hunting volatility. According to quantitative risk frameworks emphasized by institutions like the CFA Institute, systematic risk controls should incorporate volatility-adjusted buffers.
To protect your trade against premature invalidation, calculate the Average True Range (ATR) indicator value on your execution timeframe. Add a 0.5x to 1.0x ATR buffer below the lowest wick of a bullish engulfing setup (or above the highest wick of a bearish setup). This simple adjustment gives your position enough operational room to absorb routine market fluctuations without compromising your overall strategy.
Comparing Engulfing Patterns with Other Candlestick Formations
Evaluating how it differs from other classic price action formations helps you select the right setup for current market conditions.
- Hammer Candlestick: A single-candle reversal pattern featuring a long lower wick and small real body. While a hammer highlights intraday price rejection at support, that requires two candles and demonstrates explicit counter-directional momentum.
- Doji Candlestick: Represents pure market indecision where opening and closing prices are virtually identical. A doji signals that buyers and sellers are at a stalemate, whereas it confirms decisive dominant control.
- Morning Star Pattern: A three-candle bullish reversal setup incorporating a large bearish candle, a small-bodied transition candle, and a strong bullish candle. The morning star provides a more gradual transition of power compared to the sudden two-candle shift of an engulfing pattern.
- Marubozu: A single momentum candle with long real bodies and no wicks. An engulfing candle can sometimes be a marubozu, but its structural validity depends on engulfing the prior candle's body.
Conclusion
The engulfing pattern remains one of the most practical tools in price action trading, providing clear visual evidence of shifting market dominance. However, lasting trading success requires pairing pattern identification with solid market context, volume confirmation, and strict risk controls. Always manage your position sizing carefully and confirm pattern signals alongside key support and resistance levels.
- How to Build an Investment Plan That Actually Works for You?
- What Is the MACD Indicator and How to Use It
- What Is a Wedge Pattern in Trading?
- What Is Ichimoku Cloud Strategy? A Complete Trading System
- Mastering Elliott Wave Theory: Rules and Trading Strategies
- News Trading: Strategies, Execution Risks, and Risk Control
- What Is an Iron Condor Options Strategy?
- Backtesting Explained: What It Is and Why It Really Matters
- Grid Trading: Mechanics, Parameters, and Risk Strategies
- What Is Breakout Trading and How Does It Work?
- Mean Reversion: Technical Strategies and Risk Frameworks
- Momentum Trading: Indicators, Strategies, and Risk Control
- Hammer Candlestick: Structure, Meaning, and Strategy
- Doji Candlestick: Types, Signals, and Trading Strategies
- What Is the Sharpe Ratio and How to Calculate It
- What Is VWAP and How Do Traders Use It?
- Trade the Ascending Triangle: A Step-by-Step Practical Guide
- What Is the Stochastic Oscillator and How to Use It
- How to Trade the Descending Triangle Pattern
- High Frequency Trading: Speed, Algorithms, and Market Impact
- What Is Volume Profile and How to Use It in Trading
- What Is a Morning Star Pattern Candlestick?
- Trade with Parabolic SAR: A Practical Analysis Guide
- Evening Star Pattern: Structure, Rules, and Risk Controls
- Kelly Criterion: Formula, Position Sizing, and Risk
- What Is the NYSE Minimum Trading Price? Rules Explained
Disclaimer: The content on this page is intended for educational and informational purposes only. It does not constitute financial, investment, tax, or legal advice, and should not be interpreted as a recommendation to buy, sell, or hold any financial instrument or asset. Trading and investing involve significant risk, including the possible loss of your entire capital. Products such as forex, CFDs, and cryptocurrencies carry additional risks due to leverage, high volatility, and limited regulatory protection in some jurisdictions. Past performance of any financial instrument does not guarantee future results. Any market views, forecasts, or opinions expressed are those of the author at the time of writing and may not reflect current market conditions. Platform features, fees, and regulatory status are subject to change — always verify information directly with the relevant provider or regulator before making any financial decision. BrokerSpecs may receive compensation from third parties featured on this site. Always conduct your own due diligence and consider seeking advice from a licensed financial professional before investing. Portions of this article were prepared with the assistance of AI tools and reviewed by our editorial team before publication.