



Related Tags
Picture a trader opening a daily chart after a rough month for equities and noticing two lines finally intersecting after weeks of steady selling. Price has already dropped 12% from its recent peak, yet financial headlines suddenly warn that a dramatic crossover has just appeared.
When you study chart patterns, few signals generate as much dramatic commentary as a death cross. Understanding how this indicator actually forms helps you separate genuine trend shifts from delayed market noise.
What Is a Death Cross in Trading and How Does It Form?
A death cross in trading occurs when a short-term moving average, typically the 50-day simple moving average, crosses below the 200-day simple moving average. Technical analysts use this crossover to confirm that recent downward momentum has overtaken the broader long-term trend.
Rather than appearing overnight, the pattern develops across three distinct market phases that reflect shifting supply and demand:
- Exhaustion of the prior uptrend: Buying momentum fades after an extended rally, and price begins carving out lower highs while the 50-day simple moving average flattens out.
- The bearish crossover: Continued selling pulls the 50-day moving average downward until it slices beneath the slower-moving 200-day simple moving average.
- Downtrend confirmation: Price remains trapped below both moving averages, turning the 200-day line from prior support into overhead resistance during relief rallies.
As outlined in technical analysis frameworks recognized by the CFA Institute, moving averages smooth out daily price fluctuations to reveal underlying direction. Because both lines rely on past closing prices, the crossover confirms weakness that has already been building for weeks.
Death Cross vs. Golden Cross: Comparing Bearish and Bullish Signals
Every bearish technical pattern has a mirror-image counterpart, and understanding both keeps your chart reading balanced. While this pattern signals weakening momentum, a golden cross marks the point where short-term buying pressure overtakes the long-term average.
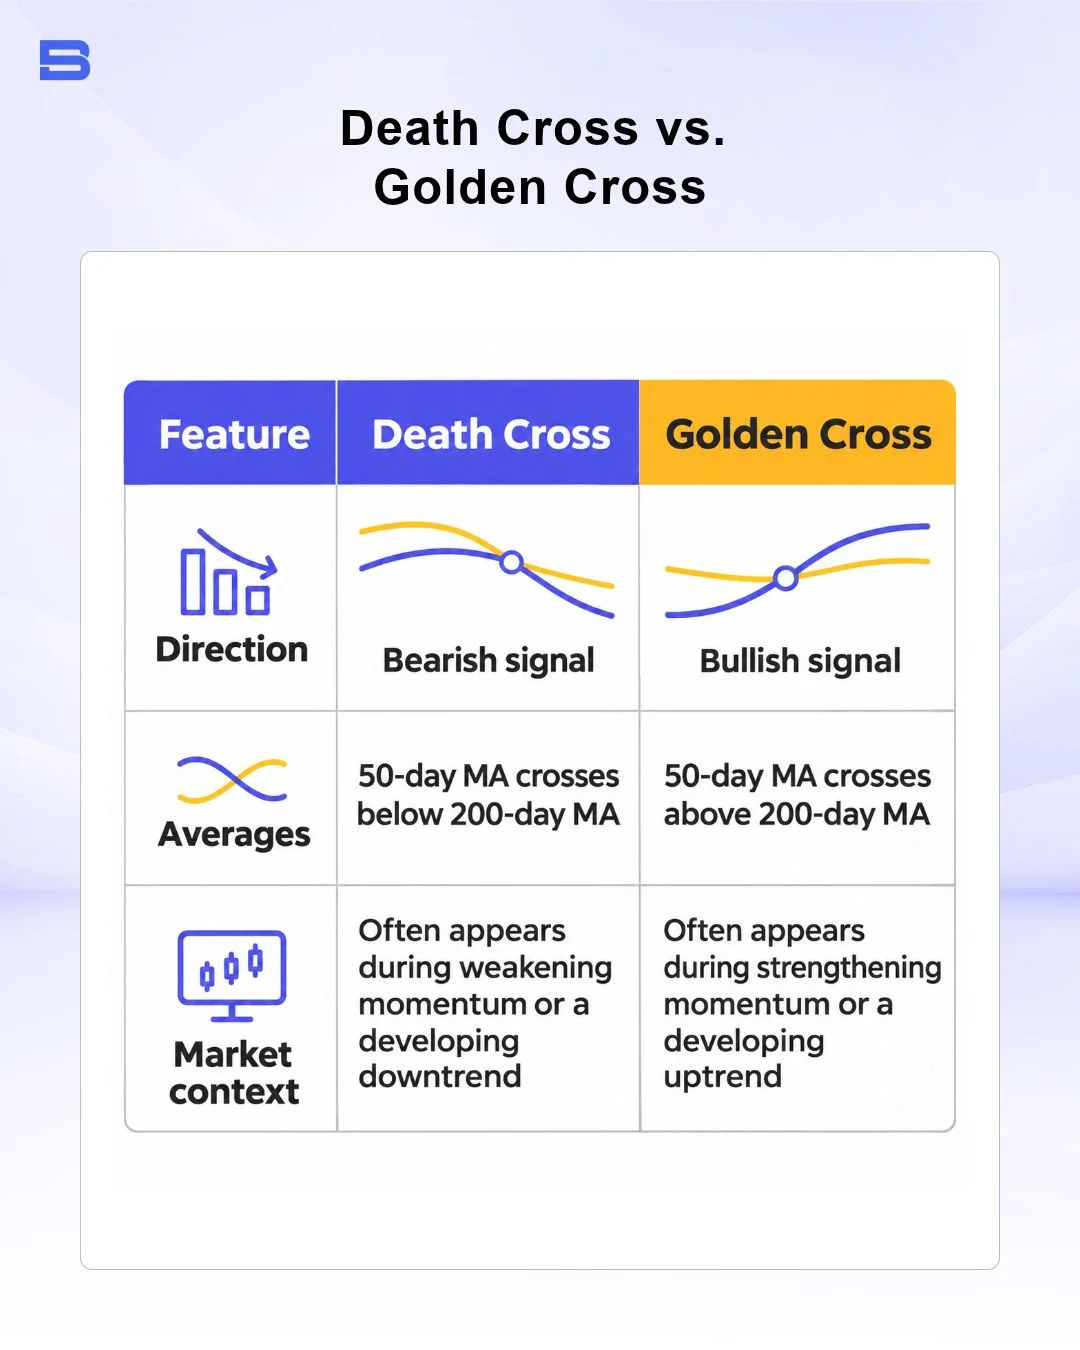
Traders who follow momentum investing strategies often monitor both crossovers to gauge whether institutional capital is rotating into or out of an index. However, treating either signal as an automatic trigger without checking broader market structure can lead to premature entries.
Moving Average Death Cross vs. MACD Death Cross: What’s the Difference?
If you spend time on trading forums or charting platforms, you will frequently hear traders mention a Moving Average Convergence Divergence (MACD) death cross alongside the classic moving-average version. Although both share an ominous name, they measure momentum on completely different timeframes and formulas.
A traditional death cross tracks two slow simple moving averages on a daily chart, typically the 50-day and 200-day lines, making it a macro trend signal that appears far less often on major stock indices than shorter-term crossover signals. By contrast, a MACD death cross happens whenever the faster MACD line (the difference between the 12-period and 26-period exponential moving averages) crosses below its 9-period signal line.
Because the MACD uses much shorter periods, its bearish crossovers can appear several times within a single year on a daily chart and even more often on intraday timeframes. Confusing a routine MACD pullback signal with a major 50/200-day trend reversal can cause you to exit long-term positions far too early.
How Traders Confirm a Death Cross Signal (And Avoid False Alarms)
Spotting a crossover on your screen is only the first step, because moving averages alone cannot tell you whether sellers have enough conviction to sustain a downtrend. Experienced traders look for confluence across volume and price structure before committing capital.
Three practical filters help separate high-probability setups from routine pullbacks:
- Expanding trading volume: A crossover accompanied by above-average selling volume suggests institutional distribution rather than light retail profit-taking.
- Price holding below the 200-day average: If price quickly reclaims the 200-day simple moving average after the cross, bearish momentum is likely fading.
- Alignment with reversal structures: A crossover carries stronger weight when it follows a completed double top or a breakdown below a multi-month support zone.
Consider a worked example on a benchmark equity index trading at 5,000 points after peaking at 5,400. When the 50-day average crosses below the 200-day average at 5,050 on heavy volume, a trader decides to open a short CFD position at 5,000 rather than chasing the initial drop.
To control risk on a $10,000 account, the trader caps maximum loss at 1% ($100) and places a stop-loss order at 5,100, just above the 200-day moving average. With a 100-point risk distance, the trader sizes the position at $1 per point, setting a target near 4,800 for a 1:2 risk-to-reward ratio. Using leverage on index CFDs magnifies the trader’s gains if the downtrend continues, yet it magnifies losses just as quickly if price reverses above the stop, especially during overnight market gaps where slippage can widen the actual exit loss beyond $100. Spreads and overnight financing charges on a CFD position held for several days also reduce the net result, so factor these costs into your risk-to-reward calculation before you enter a trade.
Limitations and Risks of Relying on a Death Cross Alone
Because this pattern is built from historical closing prices, it is strictly a lagging indicator. By the time the 50-day average crosses below the 200-day average, an asset has often already experienced a substantial decline and may be due for a short-term rebound.
In sideways or range-bound markets, this lag creates frequent whipsaws where the averages cross down near the bottom of a range and cross back up weeks later, locking in repeated small losses. Even in trending markets, late short sellers frequently get caught in a sharp dead cat bounce that triggers tight stop-losses before the broader downtrend resumes.
Cross-asset behavior also matters significantly when applying this signal. While the 50/200-day crossover has historically aligned with prolonged bear markets in major stock indices, applying the exact same settings to high-volatility forex pairs or cryptocurrencies often generates far more false alarms due to 24-hour trading cycles and sudden liquidity swings, a risk environment highlighted in investor guidance from the International Organization of Securities Commissions (IOSCO). Building clear exit rules into your investment plan helps prevent a single technical signal from overriding disciplined risk management.
Using the Death Cross as Part of a Broader Strategy
A death cross is best viewed as a rear-view confirmation of weakening momentum rather than a crystal ball for predicting market crashes. When you combine this signal with volume analysis, broader price structure, and strict position sizing, you can respond to shifting trends calmly without letting dramatic headlines dictate your trades.
- How to Build an Investment Plan That Actually Works for You?
- What Is the MACD Indicator and How to Use It
- What Is a Wedge Pattern in Trading?
- What Is Ichimoku Cloud Strategy? A Complete Trading System
- Mastering Elliott Wave Theory: Rules and Trading Strategies
- News Trading: Strategies, Execution Risks, and Risk Control
- What Is an Iron Condor Options Strategy?
- Backtesting Explained: What It Is and Why It Really Matters
- Grid Trading: Mechanics, Parameters, and Risk Strategies
- What Is Breakout Trading and How Does It Work?
- Mean Reversion: Technical Strategies and Risk Frameworks
- Momentum Trading: Indicators, Strategies, and Risk Control
- Hammer Candlestick: Structure, Meaning, and Strategy
- Doji Candlestick: Types, Signals, and Trading Strategies
- What Is the Sharpe Ratio and How to Calculate It
- What Is VWAP and How Do Traders Use It?
- Trade the Ascending Triangle: A Step-by-Step Practical Guide
- What Is the Stochastic Oscillator and How to Use It
- How to Trade the Descending Triangle Pattern
- High Frequency Trading: Speed, Algorithms, and Market Impact
- What Is Volume Profile and How to Use It in Trading
- What Is a Morning Star Pattern Candlestick?
- Trade with Parabolic SAR: A Practical Analysis Guide
- Evening Star Pattern: Structure, Rules, and Risk Controls
- Kelly Criterion: Formula, Position Sizing, and Risk
- What Is the NYSE Minimum Trading Price? Rules Explained
Disclaimer: The content on this page is intended for educational and informational purposes only. It does not constitute financial, investment, tax, or legal advice, and should not be interpreted as a recommendation to buy, sell, or hold any financial instrument or asset. Trading and investing involve significant risk, including the possible loss of your entire capital. Products such as forex, CFDs, and cryptocurrencies carry additional risks due to leverage, high volatility, and limited regulatory protection in some jurisdictions. Past performance of any financial instrument does not guarantee future results. Any market views, forecasts, or opinions expressed are those of the author at the time of writing and may not reflect current market conditions. Platform features, fees, and regulatory status are subject to change — always verify information directly with the relevant provider or regulator before making any financial decision. BrokerSpecs may receive compensation from third parties featured on this site. Always conduct your own due diligence and consider seeking advice from a licensed financial professional before investing. Portions of this article were prepared with the assistance of AI tools and reviewed by our editorial team before publication.