



Related Tags
You pull up a chart after a steep six-month sell-off and see nothing happening. Price has bounced inside the same narrow horizontal band for 10 straight weeks while headlines remain gloomy and retail sentiment sits near rock bottom. Yet beneath that flat price action, large institutional buyers may be quietly absorbing every share or token panicked sellers are willing to offload during an accumulation phase.
How the Accumulation Phase in Trading Works
The accumulation phase in trading is a prolonged sideways price range following a downtrend where institutional participants gradually buy supply before an uptrend begins. Under classic market-cycle frameworks such as Dow Theory, major trends rarely reverse in a single dramatic V-shaped bounce. Instead, the market transitions from falling prices into an equilibrium zone where selling pressure dries up, and long-term demand takes control.
Large funds, pension managers, and institutional desks cannot buy $200 million worth of an asset with a single market order without triggering significant slippage against themselves. If they buy too aggressively, price spikes before they finish filling their allocation. To prevent that, institutions break orders into smaller tranches, buying passively near range support and pausing whenever price approaches range resistance, which keeps volatility compressed and masks their footprint from casual chart watchers.
The 5 Stages of Wyckoff Accumulation (Phases A to E)
Analyst Richard Wyckoff mapped institutional range-building into a five-stage schematic under the Wyckoff Method. Understanding these phases helps you track whether a sideways market is genuinely absorbing supply or simply pausing before another drop:
- Phase A (Stopping the Downtrend): Selling pressure peaks in a high-volume Selling Climax (SC), followed by an Automatic Rally (AR) as short sellers cover and bargain hunters step in. These two swings establish the initial support and resistance boundaries of the trading range.
- Phase B (Building the Cause): Price oscillates sideways while institutions absorb remaining supply, often printing Secondary Tests (ST) near support on noticeably lower volume than the initial climax.
- Phase C (The Spring): Price briefly dips below range support to trigger retail stop-losses and lure late short sellers, then quickly snaps back inside the range.
- Phase D (Breakout Preparation): Demand overtakes supply, producing a Sign of Strength (SOS) rally on expanding volume followed by a shallow pullback called the Last Point of Support (LPS).
- Phase E (Markup): Price clears range resistance decisively and enters a sustained uptrend.
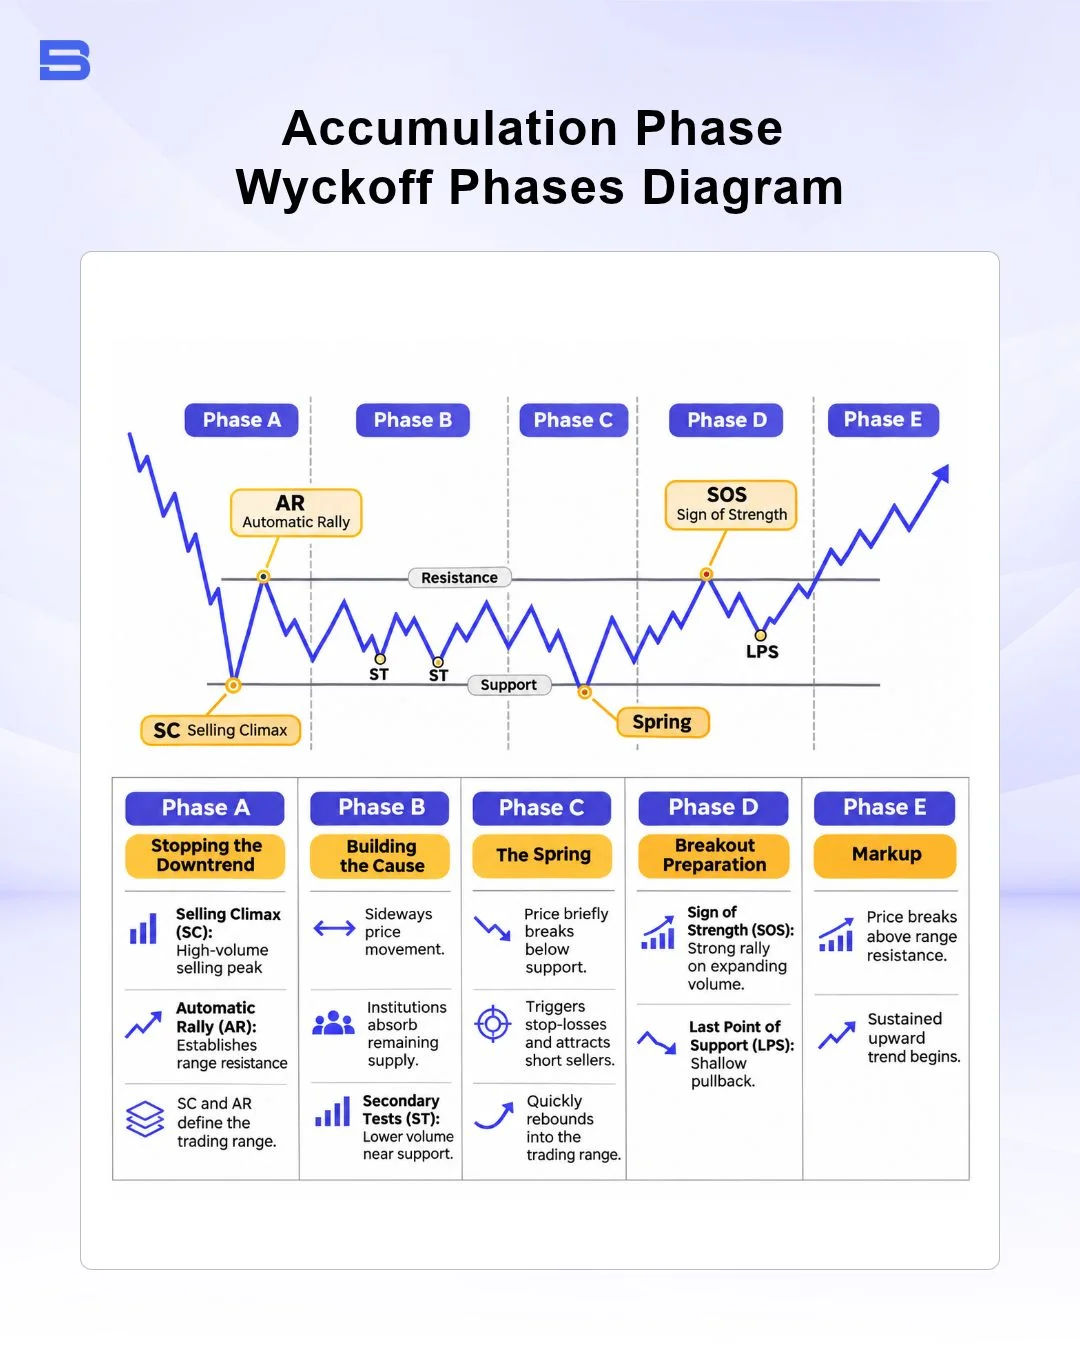
Consider a mid-cap equity that falls from $75 to $40 and consolidates between $40 support and $48 resistance for three months. In Phase C, price briefly breaks down to $39.20 on a spike in volume, triggers stop orders, and closes back at $41.10 within two sessions. A disciplined trader who waits for Phase D confirmation enters at $50.00 after a high-volume close above $48.00, placing a protective stop-loss at $45.50 and risking $4.50 per share rather than guessing the bottom inside the range.
Key Signals to Identify an Accumulation Phase (Volume and Price Action)
Learning how to identify an accumulation phase starts with watching how volume behaves relative to price swings inside a horizontal range. During genuine absorption, trading volume typically contracts on downward drifts toward support and expands when buyers push price back toward resistance.
Several technical tools help confirm whether buying pressure is building beneath the surface:
- Volume Contraction and Up-Day Expansion: On-balance volume (OBV), a running total that adds volume on up days and subtracts it on down days, often trends higher even while price remains flat, signaling net buying into weakness.
- Anchored VWAP: Anchoring a volume-weighted average price line to the Selling Climax low shows whether buyers are consistently defending the average institutional cost basis.
- Order Flow and Footprint Chart Delta: Advanced traders inspect bid-ask volume inside individual candles, including delta (the difference between volume traded at the ask and volume traded at the bid), to spot large passive limit buy orders absorbing aggressive market sells at support.
Relying on a single indicator rarely provides enough conviction, so combining horizontal range boundaries with volume confirmation gives you a clearer read on institutional participation.
Accumulation vs. Distribution Phase: How to Tell Them Apart
Because an accumulation phase and a distribution phase both look like sideways consolidation boxes on a price chart, mistaking one for the other is a costly error. The context preceding the range and the volume signature at its boundaries separate institutional buying from institutional selling.
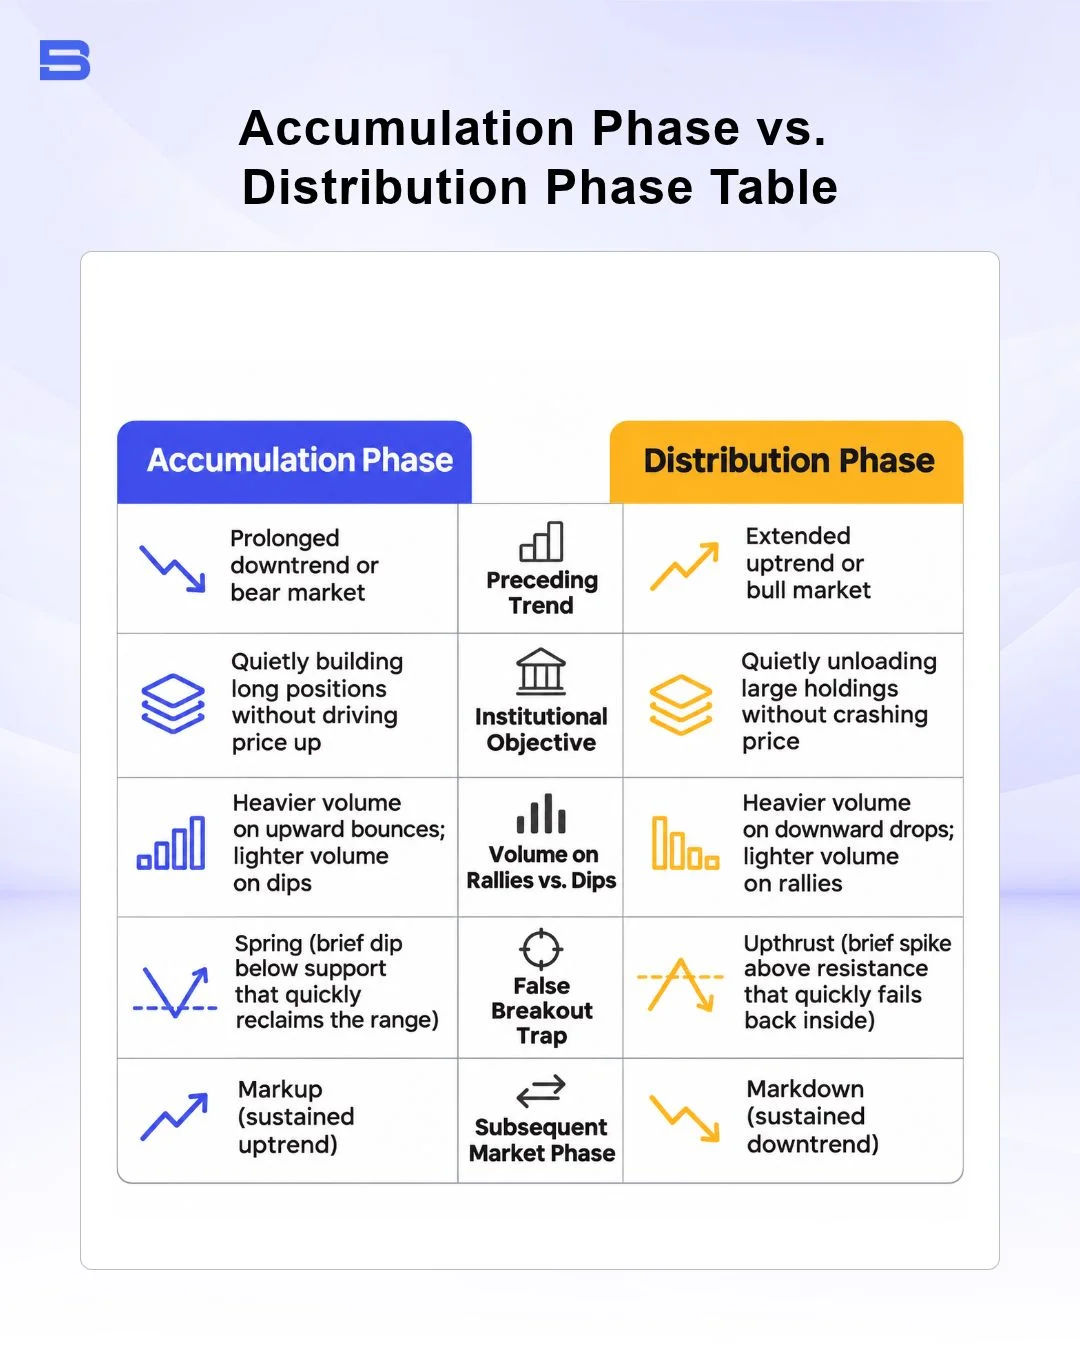
Comparing these five structural clues before committing capital helps you avoid buying into a ceiling where large holders are actively exiting.
Risks and Common Mistakes During Consolidation Ranges
Sideways ranges carry substantial risk because consolidation does not guarantee a bullish reversal. A flat base after a decline can easily turn into a redistribution pause that resolves lower, trapping traders who buy early in anticipation of a markup.
A common mistake is treating every dip below support as an automatic Spring without waiting for price to reclaim the range on strong volume. If price breaks below support and stalls there on heavy selling, the range may be failing as accumulation, and the downtrend could resume instead of forming a bear trap. Trading illiquid small-cap stocks or low-volume altcoins adds further danger because wide spreads and thin order books let single large orders distort volume signals.
To manage this uncertainty, consider sizing positions conservatively—risking no more than 1% to 2% of your account equity per setup—and waiting for confirmed range structure rather than trying to catch the exact low. The International Organization of Securities Commissions (IOSCO) has warned that retail investors may not be able to fully assess the risks of complex leveraged over-the-counter products, such as CFDs and rolling-spot forex contracts, or withstand the losses these products can cause.
The Bottom Line
An accumulation phase marks the quiet transition from fear-driven selling to methodical institutional buying, giving patient traders a structured framework to spot emerging uptrends. Wait for clear volume and price confirmation at range boundaries, respect the possibility of a failed breakdown, and size every position around a defined stop-loss.
- How to Build an Investment Plan That Actually Works for You?
- What Is the MACD Indicator and How to Use It
- What Is a Wedge Pattern in Trading?
- What Is Ichimoku Cloud Strategy? A Complete Trading System
- Mastering Elliott Wave Theory: Rules and Trading Strategies
- News Trading: Strategies, Execution Risks, and Risk Control
- What Is an Iron Condor Options Strategy?
- Backtesting Explained: What It Is and Why It Really Matters
- Grid Trading: Mechanics, Parameters, and Risk Strategies
- What Is Breakout Trading and How Does It Work?
- Mean Reversion: Technical Strategies and Risk Frameworks
- Momentum Trading: Indicators, Strategies, and Risk Control
- Hammer Candlestick: Structure, Meaning, and Strategy
- Doji Candlestick: Types, Signals, and Trading Strategies
- What Is the Sharpe Ratio and How to Calculate It
- What Is VWAP and How Do Traders Use It?
- Trade the Ascending Triangle: A Step-by-Step Practical Guide
- What Is the Stochastic Oscillator and How to Use It
- How to Trade the Descending Triangle Pattern
- High Frequency Trading: Speed, Algorithms, and Market Impact
- What Is Volume Profile and How to Use It in Trading
- What Is a Morning Star Pattern Candlestick?
- Trade with Parabolic SAR: A Practical Analysis Guide
- Evening Star Pattern: Structure, Rules, and Risk Controls
- Kelly Criterion: Formula, Position Sizing, and Risk
- What Is the NYSE Minimum Trading Price? Rules Explained
Disclaimer: The content on this page is intended for educational and informational purposes only. It does not constitute financial, investment, tax, or legal advice, and should not be interpreted as a recommendation to buy, sell, or hold any financial instrument or asset. Trading and investing involve significant risk, including the possible loss of your entire capital. Products such as forex, CFDs, and cryptocurrencies carry additional risks due to leverage, high volatility, and limited regulatory protection in some jurisdictions. Past performance of any financial instrument does not guarantee future results. Any market views, forecasts, or opinions expressed are those of the author at the time of writing and may not reflect current market conditions. Platform features, fees, and regulatory status are subject to change — always verify information directly with the relevant provider or regulator before making any financial decision. BrokerSpecs may receive compensation from third parties featured on this site. Always conduct your own due diligence and consider seeking advice from a licensed financial professional before investing. Portions of this article were prepared with the assistance of AI tools and reviewed by our editorial team before publication.