



Related Tags
You watch a currency pair drift sideways for hours, only for price to abruptly surge upward by eighty pips in a single candle. Retail buyers scramble to jump aboard at the top, only to get trapped when the market suddenly stalls and pulls back.
That explosive burst may not have been random price noise. Traders often read it as the footprint of institutional order flow, an idea that underpins much of price action trading.
What Is Supply and Demand in Trading and How Does It Work?
Supply and demand trading is a method that identifies price zones where large institutional order imbalances cause sharp market rallies or drops.
Think of financial markets like a wholesale auction house rather than a static department store. When large banks step in to accumulate assets, their buying volume absorbs all available floating sellers, forcing price rapidly higher to discover fresh liquidity.
Large institutions cannot fill multi-million-dollar positions at a single price tick without creating significant slippage. Consequently, supply and demand traders assume that substantial limit orders can remain unexecuted at the base when price runs away.
Traders track these origin points because when price eventually returns to that level, those residual institutional orders can trigger another sharp reaction. This principle lies at the heart of broader Inner Circle Trader (ICT) concepts and institutional order-flow analysis.
How Institutional Order Imbalance Creates Market Zones
A market stays balanced when buyers and sellers trade equal volume within a narrow consolidation range. A market imbalance appears when institutional participants deploy large market orders, and that balance instantly evaporates.
This sudden vacuum of counterparty liquidity creates an aggressive directional move. The narrow band of consolidation right before that explosive departure marks the actual supply or demand zone on your chart.
Supply and Demand vs Support and Resistance: The Key Differences
Many beginners mistakenly assume that supply and demand zones are simply traditional support and resistance levels drawn with thicker rectangles. While both concepts aim to map potential turning points, their core logic and lifespans differ substantially.
Standard horizontal levels rely on visible historical highs and lows where price bounced repeatedly in the past. In contrast, supply and demand focuses strictly on the origin of aggressive moves where liquidity was completely depleted.
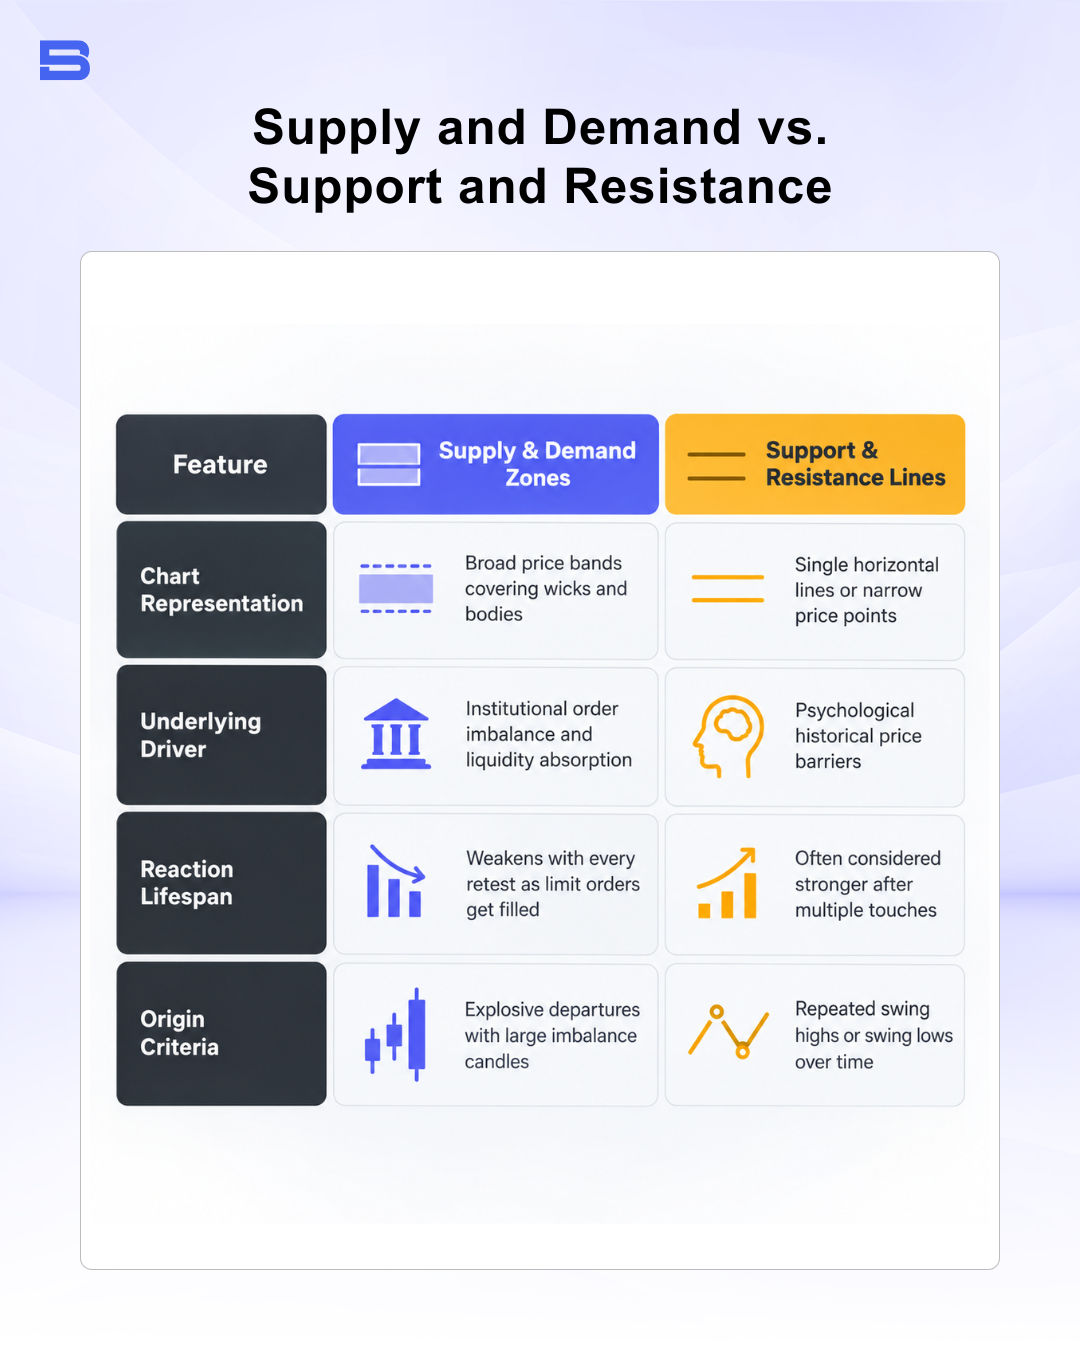
Understanding this distinction helps you avoid treating old chart levels like permanent barriers.
The table below summarizes how the two approaches differ in what you draw, what drives each level, how long it stays useful, and where it starts.
| Feature | Support and Resistance | Supply and Demand |
|---|---|---|
| Chart representation | A thin horizontal line | A rectangular zone |
| Drivers | Repeated bounces at visible highs and lows | Unfilled institutional orders left behind |
| Lifespan | Can hold across many tests | Weakens each time price retests it |
| Origin | Past turning points | The base before an explosive move |
How to Identify and Draw Supply and Demand Zones on a Chart
Locating valid zones requires scanning your chart backward from major price thrusts rather than guessing where price might reverse next. You want to spot where institutions left a clear footprint on the candlestick chart.
Follow this systematic three-step process to map high-probability zones:
- Locate an explosive move. Search for two or three consecutive, large-bodied candles that expanded rapidly away from a consolidation area.
- Identify the base. Look directly before the explosive thrust to find the small consolidation cluster or single opposing candle where price paused.
- Box the zone boundaries. For a demand zone, draw the upper proximal line at the highest body of the base, and the lower distal line at the lowest wick. For a supply zone, place the lower proximal line at the lowest body of the base and the upper distal line at the highest wick.
The Four Core Zone Formations
Price zones fall into two main behavioral categories: reversals and continuations. Reversal setups represent shifts in market control, while continuation setups occur when an established trend pauses briefly before resuming.
The four structural patterns you will encounter on the chart are:
- Drop-Base-Rally (DBR): A downward price leg pauses to build a base, followed by a sharp rally upward. This creates a demand reversal zone.
- Rally-Base-Drop (RBD): An upward thrust stalls into sideways consolidation, followed by a sharp downward collapse. This forms a primary supply reversal zone.
- Rally-Base-Rally (RBR): An ongoing uptrend consolidates briefly into a shallow base before breaking upward again. This marks a bullish continuation demand zone.
- Drop-Base-Drop (DBD): A downtrend pauses briefly to build a small base before plunging downward again. This marks a bearish continuation supply zone.
Building a Supply and Demand Trading Strategy: Core Setup Rules
Once you have marked your zones, entering trades blindly as soon as price touches a box is an easy way to lose capital. A sustainable supply and demand trading strategy requires strict entry confirmation and disciplined risk management.
Before committing capital, verify three rules on your checklist:
- Alignment with higher timeframe market structure.
- Freshness of the zone, confirming price has not already retested and drained the level.
- Confirmation on a lower timeframe, such as a shift in market structure or rejection wick inside the zone.
Consider a worked scenario on EUR/USD. The daily chart identifies a fresh Drop-Base-Rally demand zone between 1.0830 and 1.0850.
You wait for price to retrace into the zone at 1.0850 and set your protective stop-loss 5 pips below the distal line at 1.0825, representing 25 pips of risk. You place your take-profit target at the next major overhead supply zone at 1.0925, offering 75 pips of reward.
On a $10,000 trading account, risking a conservative 1% ($100), you size the position at 0.4 standard lots ($4 per pip), because $100 divided by 25 pips of risk equals $4 per pip. In this hypothetical example, a winning trade would make $300 for a 1:3 risk-to-reward ratio, while a failed setup would lose about $100 if your stop-loss fills at the planned level. Slippage or gaps can cause a larger loss, and this example is for illustration only, not a prediction of results. Fixed-percentage position sizing is a widely used risk-management practice. Building consistent habits around these calculations is essential when constructing your investment plan.
How Supply and Demand Differs from Order Block Trading
Traders exploring institutional concepts often ask how classic supply and demand differs from order block trading. While both models track institutional footprints, they originate from different analytical frameworks.
Classic supply and demand focuses on multi-candle consolidation bases and explosive exits. By contrast, the smart money concept (SMC) isolates the single final opposing candle before a sharp institutional move. SMC also uses extra tools, such as fair value gaps (price areas the market skipped over) and liquidity sweeps (quick moves that trigger clustered stop-losses), to refine entry timing.
Supply and Demand Trading Risks: Traps, Invalidation, and Capital Protection
No technical strategy produces consistent profits without rigorous risk controls. Supply and demand zones frequently fail when broader macroeconomic sentiment shifts or institutional algorithms hunt retail liquidity.
A common trap for beginners is trading stale zones. Each time price revisits a demand zone, remaining limit orders are absorbed, leaving fewer buyers to defend the level on subsequent retests.
Furthermore, large participants can sometimes trigger false breakouts beneath obvious distal lines, collecting retail stop-losses before price moves in the intended direction. Major economic data releases can also trigger severe slippage, causing market orders to fill far beyond your intended stop level.
When trading these setups via retail contracts for difference (CFDs), leverage amplifies your potential returns when you are right, but it accelerates capital losses just as quickly when a zone breaks. Leverage restrictions and risk warnings for retail derivatives are strictly enforced by authorities like the Financial Conduct Authority (FCA). Always risk only a small, fixed percentage of your account balance on any single setup.
Trading Fresh Zones With Capped Risk
Supply and demand trading shifts your perspective from chasing market momentum to anticipating where large institutions conduct business. By prioritizing fresh imbalance zones, confirming entries on lower timeframes, and capping your risk per trade, you protect your capital while navigating volatile markets with clarity.
- How to Build an Investment Plan That Actually Works for You?
- What Is the MACD Indicator and How to Use It
- What Is a Wedge Pattern in Trading?
- What Is Ichimoku Cloud Strategy? A Complete Trading System
- Mastering Elliott Wave Theory: Rules and Trading Strategies
- News Trading: Strategies, Execution Risks, and Risk Control
- What Is an Iron Condor Options Strategy?
- Backtesting Explained: What It Is and Why It Really Matters
- Grid Trading: Mechanics, Parameters, and Risk Strategies
- What Is Breakout Trading and How Does It Work?
- Mean Reversion: Technical Strategies and Risk Frameworks
- Momentum Trading: Indicators, Strategies, and Risk Control
- Hammer Candlestick: Structure, Meaning, and Strategy
- Doji Candlestick: Types, Signals, and Trading Strategies
- What Is the Sharpe Ratio and How to Calculate It
- What Is VWAP and How Do Traders Use It?
- Trade the Ascending Triangle: A Step-by-Step Practical Guide
- What Is the Stochastic Oscillator and How to Use It
- How to Trade the Descending Triangle Pattern
- High Frequency Trading: Speed, Algorithms, and Market Impact
- What Is Volume Profile and How to Use It in Trading
- What Is a Morning Star Pattern Candlestick?
- Trade with Parabolic SAR: A Practical Analysis Guide
- Evening Star Pattern: Structure, Rules, and Risk Controls
- Kelly Criterion: Formula, Position Sizing, and Risk
- What Is the NYSE Minimum Trading Price? Rules Explained
Disclaimer: The content on this page is intended for educational and informational purposes only. It does not constitute financial, investment, tax, or legal advice, and should not be interpreted as a recommendation to buy, sell, or hold any financial instrument or asset. Trading and investing involve significant risk, including the possible loss of your entire capital. Products such as forex, CFDs, and cryptocurrencies carry additional risks due to leverage, high volatility, and limited regulatory protection in some jurisdictions. Past performance of any financial instrument does not guarantee future results. Any market views, forecasts, or opinions expressed are those of the author at the time of writing and may not reflect current market conditions. Platform features, fees, and regulatory status are subject to change — always verify information directly with the relevant provider or regulator before making any financial decision. BrokerSpecs may receive compensation from third parties featured on this site. Always conduct your own due diligence and consider seeking advice from a licensed financial professional before investing. Portions of this article were prepared with the assistance of AI tools and reviewed by our editorial team before publication.