



Related Tags
You are watching a currency pair or stock climb steadily on your screen, printing one higher high after another. On the surface, buyers appear firmly in control, yet each upward push travels a slightly shorter distance than the last before sellers step back in.
That narrowing climb is the classic footprint of a rising wedge, a price formation that often catches late buyers off guard when support finally gives way.
What Is a Rising Wedge Chart Pattern and How Does It Form?
A rising wedge chart pattern is a bearish technical formation where price moves higher between two upward-sloping, converging trendlines before breaking below support. As the lower support line rises faster than the upper resistance line, the trading range compresses and signals fading buying momentum.
Every valid chart pattern reflects a shift in the balance between buyers and sellers rather than magic geometry. In a rising wedge, buyers are still willing to bid prices above prior highs, but their follow-through weakens on each swing while sellers steadily step in at slightly higher levels.
When price eventually closes below the lower trendline, trapped long positions often rush to exit at the same time short sellers enter, accelerating the downward move.
Key Characteristics to Spot on a Chart
To confirm you are looking at a genuine rising wedge rather than random upward drift, check for these structural elements before planning a trade:
- Two upward-sloping, converging lines: Both the upper resistance line and lower support line must angle upward, with the support line rising at a steeper angle so the two lines narrow toward an apex.
- At least two touchpoints per trendline: You need a minimum of two distinct swing highs on the upper boundary and two higher swing lows on the lower boundary, though three touches on each side provide stronger structural validation.
- Contracting price range: Each successive rally inside the wedge should cover less vertical distance than the previous swing, showing visible compression.
- Distinction from a channel: Unlike an ascending channel, where support and resistance remain parallel and favor trend continuation, a rising wedge pinches price action into a tighter corner.
Is a Rising Wedge Pattern Bullish or Bearish?
A rising wedge pattern carries a bearish bias in both uptrends and downtrends, though the market context determines whether it signals a trend reversal or a trend continuation.
When a rising wedge forms after a prolonged advance, it acts as a bearish reversal pattern. Buyers who rode the earlier rally begin taking profits into shrinking highs, and a breakdown below the lower trendline often marks the start of a broader downward swing.
When the same structure develops during an established downtrend, it functions as a bearish continuation pattern. Here, the upward-sloping wedge is often a weak counter-trend bounce or pause, after which sellers may regain control and push price toward fresh lows.
Neither setup is guaranteed to break lower, however. If strong buying volume pushes price decisively above the upper resistance line instead of breaking support, the bearish thesis is invalidated, and traders treat the move as a bullish breakout.
How to Trade Rising Wedge Pattern Setups Step by Step
Learning how to trade rising wedge pattern setups starts with patience, because entering while price is still bouncing inside the wedge exposes you to sudden upward spikes. Disciplined breakout trading waits for the market to prove that support has failed before committing capital.
- Map the converging boundaries: Draw the upper trendline across the swing highs and the steeper lower trendline across the higher swing lows, ensuring the lines clearly converge.
- Wait for a confirmed breakdown close: Avoid selling simply because price touches the upper line. Instead, wait for a full candle to close below the lower support trendline on your chosen timeframe.
- Choose an entry trigger: You can enter either on the close of the breakdown candle or on a subsequent retest if price rallies back to kiss the broken lower trendline from underneath.
- Define invalidation and targets before clicking execute: Set your stop-loss order and profit target in advance so emotional swings do not dictate your exit mid-trade.
Confirming the Breakdown With Volume and Momentum
Volume and momentum indicators help separate genuine breakdowns from temporary dips. During a textbook rising wedge formation, trading volume tends to decline steadily as price climbs, showing that fewer buyers are willing to chase higher prices.
When price finally slices below the lower trendline, look for an expansion in selling volume to confirm stronger market participation. Pairing the pattern with bearish divergence on the Relative Strength Index (RSI) indicator — where price makes higher highs inside the wedge while the RSI prints lower highs — adds further confirmation that upward momentum is weakening.
Suppose EUR/USD climbs inside a rising wedge whose widest vertical height at the base measures 150 pips, bounded between 1.0800 and 1.0950. As the lines converge, a 4-hour candle closes decisively below the lower support trendline at 1.0880, triggering a short entry.
You place your stop-loss at 1.0930, back inside the wedge above the broken support trendline, risking 50 pips on the trade. Using the standard measured-move technique, you project the wedge’s 150-pip base height downward from the 1.0880 breakdown point to set a target at 1.0730, creating a 1:3 risk-reward ratio.
Even with a 1:3 setup, no single chart pattern wins every time, and sudden news releases or thin liquidity can cause slippage that fills your stop worse than 1.0930. Trading leveraged forex or CFDs magnifies potential gains on a 150-pip move, yet that same leverage magnifies losses just as quickly if price reverses upward, so sizing your position to risk only 1% to 2% of your account can help limit outsized drawdowns.
Rising Wedge vs. Falling Wedge and Ascending Triangle
Because converging trendlines appear across several technical formations, traders frequently confuse the rising wedge with bullish patterns that look similar at a glance. Comparing their slope geometry and trend context prevents taking trades in the wrong direction.
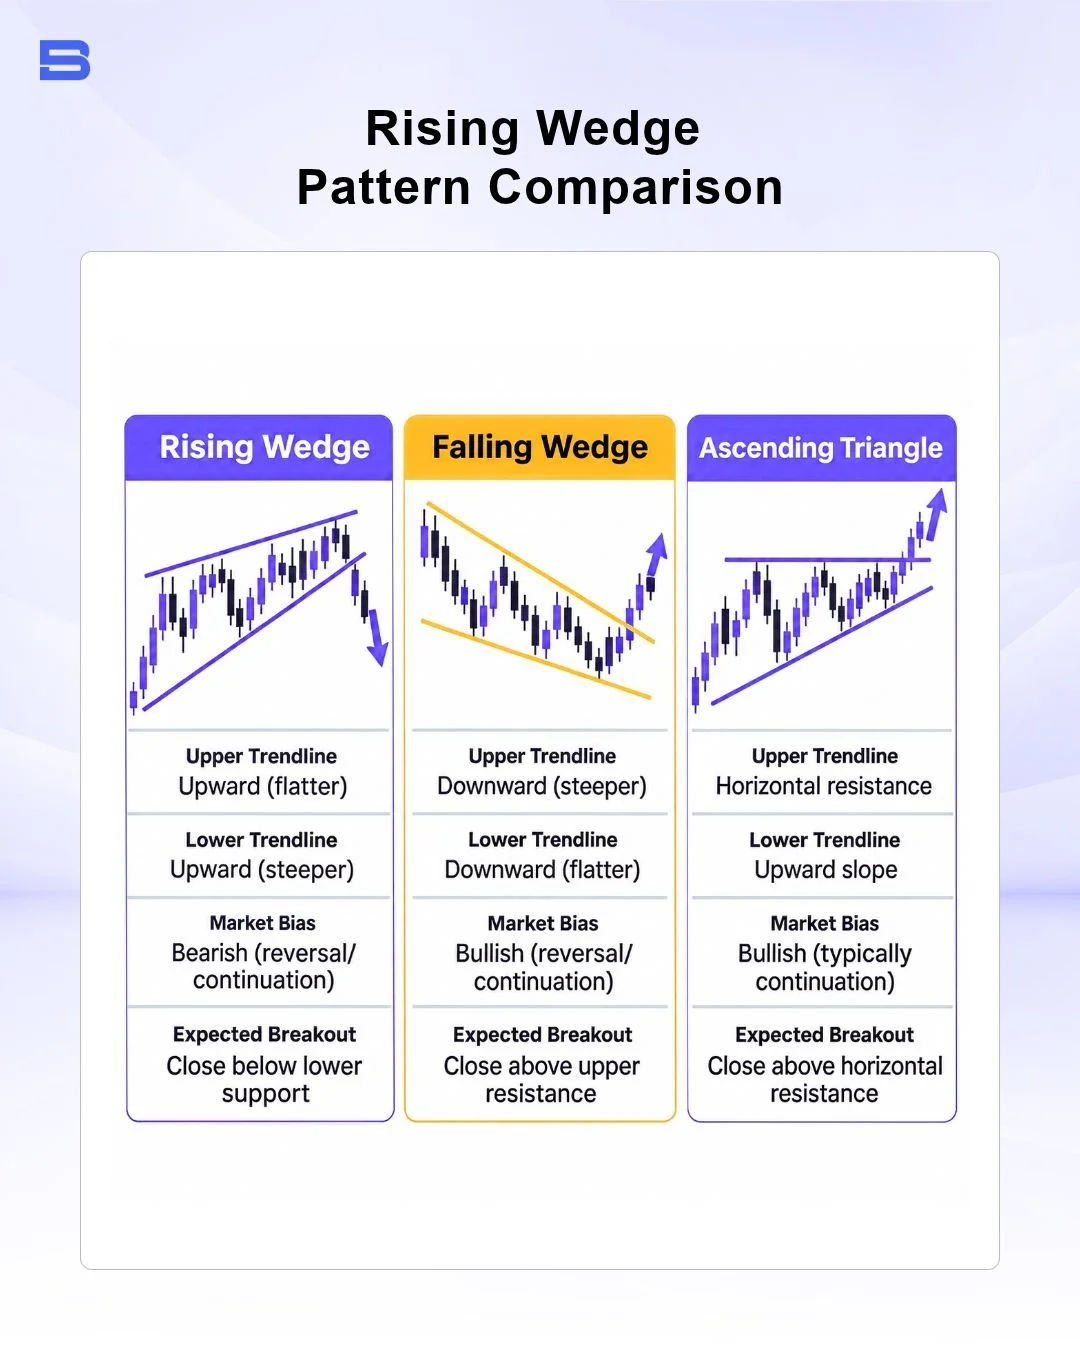
While a falling wedge pattern angles downward and signals weakening selling pressure ahead of a bullish breakout, an ascending triangle chart pattern holds a flat horizontal ceiling where buyers repeatedly test resistance at the same price.
Common Mistakes and False Breakouts to Watch For
Even textbook rising wedges can fail, and losses around this pattern may come from execution errors rather than from misreading the lines. Understanding how a rising wedge false breakout develops helps you avoid getting caught on the wrong side of sharp reversals.
- Shorting too early inside the wedge: Entering before price closes below lower support leaves you exposed if the trend extends for two or three more swings higher.
- Falling for a bear trap or bull trap: A brief intraday wick below support that snaps right back inside the wedge is a classic false breakdown, just as a quick spike above resistance can turn into a bull trap before price drops.
- Ignoring market liquidity and news: Trading breakdowns right before central bank rate decisions or during low-liquidity session transitions increases the risk of erratic whipsaws and wide spreads.
- Over-leveraging a single setup: No standalone technical signal justifies oversized risk on one trade. In a 2016 survey report, the International Organization of Securities Commissions (IOSCO) flagged concerns that retail investors in leveraged forex and CFD products may not be able to assess the risks or withstand the losses they can incur.
Conclusion
A rising wedge pattern offers a clear visual warning that an upward price move is losing steam, whether it appears at the top of an uptrend or as a pause inside a downtrend. By waiting for a confirmed close below lower support, checking volume and momentum, and capping your risk with a predefined stop-loss, you can trade the breakdown with discipline rather than guesswork.
- How to Build an Investment Plan That Actually Works for You?
- What Is the MACD Indicator and How to Use It
- What Is a Wedge Pattern in Trading?
- What Is Ichimoku Cloud Strategy? A Complete Trading System
- Mastering Elliott Wave Theory: Rules and Trading Strategies
- News Trading: Strategies, Execution Risks, and Risk Control
- What Is an Iron Condor Options Strategy?
- Backtesting Explained: What It Is and Why It Really Matters
- Grid Trading: Mechanics, Parameters, and Risk Strategies
- What Is Breakout Trading and How Does It Work?
- Mean Reversion: Technical Strategies and Risk Frameworks
- Momentum Trading: Indicators, Strategies, and Risk Control
- Hammer Candlestick: Structure, Meaning, and Strategy
- Doji Candlestick: Types, Signals, and Trading Strategies
- What Is the Sharpe Ratio and How to Calculate It
- What Is VWAP and How Do Traders Use It?
- Trade the Ascending Triangle: A Step-by-Step Practical Guide
- What Is the Stochastic Oscillator and How to Use It
- How to Trade the Descending Triangle Pattern
- High Frequency Trading: Speed, Algorithms, and Market Impact
- What Is Volume Profile and How to Use It in Trading
- What Is a Morning Star Pattern Candlestick?
- Trade with Parabolic SAR: A Practical Analysis Guide
- Evening Star Pattern: Structure, Rules, and Risk Controls
- Kelly Criterion: Formula, Position Sizing, and Risk
- What Is the NYSE Minimum Trading Price? Rules Explained
Disclaimer: The content on this page is intended for educational and informational purposes only. It does not constitute financial, investment, tax, or legal advice, and should not be interpreted as a recommendation to buy, sell, or hold any financial instrument or asset. Trading and investing involve significant risk, including the possible loss of your entire capital. Products such as forex, CFDs, and cryptocurrencies carry additional risks due to leverage, high volatility, and limited regulatory protection in some jurisdictions. Past performance of any financial instrument does not guarantee future results. Any market views, forecasts, or opinions expressed are those of the author at the time of writing and may not reflect current market conditions. Platform features, fees, and regulatory status are subject to change — always verify information directly with the relevant provider or regulator before making any financial decision. BrokerSpecs may receive compensation from third parties featured on this site. Always conduct your own due diligence and consider seeking advice from a licensed financial professional before investing. Portions of this article were prepared with the assistance of AI tools and reviewed by our editorial team before publication.