



Related Tags
Imagine sitting at your trading desk, watching spot gold surge through technical resistance while your long tech CFD position abruptly plunges into an unexpected drawdown. You examine the stock chart alone, looking for broken trendlines or company-specific earnings misses, but find none. In modern global finance, no single asset class trades in a vacuum, and looking at an individual instrument’s price chart in isolation reveals only half the picture.
What Is Intermarket Analysis and How Does It Work?
Intermarket analysis evaluates price relationships among currencies, bonds, commodities, and equities to determine overall market direction. Instead of treating each chart as an independent price action island, this methodology assesses global liquidity flow across asset boundaries.
Capital consistently seeks the most attractive balance of return, safety, and liquidity. When interest rates shift, debt markets react immediately. These interest rate movements filter through sovereign debt yields, shift international currency valuations, dictate corporate financing costs, and reshape commodity demand. Cross-border capital flow tracking published by institutions like the Bank for International Settlements (BIS) reflects how institutional portfolios adjust allocations across asset classes when macroeconomic regimes rotate.
Consider a scenario where the benchmark 10-year US Treasury yield climbs 50 basis points over a three-week window. A trader viewing only stock indices might remain bullish, but the yield spike may set off a chain of cross-asset reactions. Higher sovereign yields can attract foreign capital, which has historically tended to lift the US Dollar Index.
A stronger dollar can create headwinds for dollar-denominated assets, often pressing gold and raw materials lower. At the same time, higher discount rates may compress equity valuation multiples and add selling pressure across growth equities.
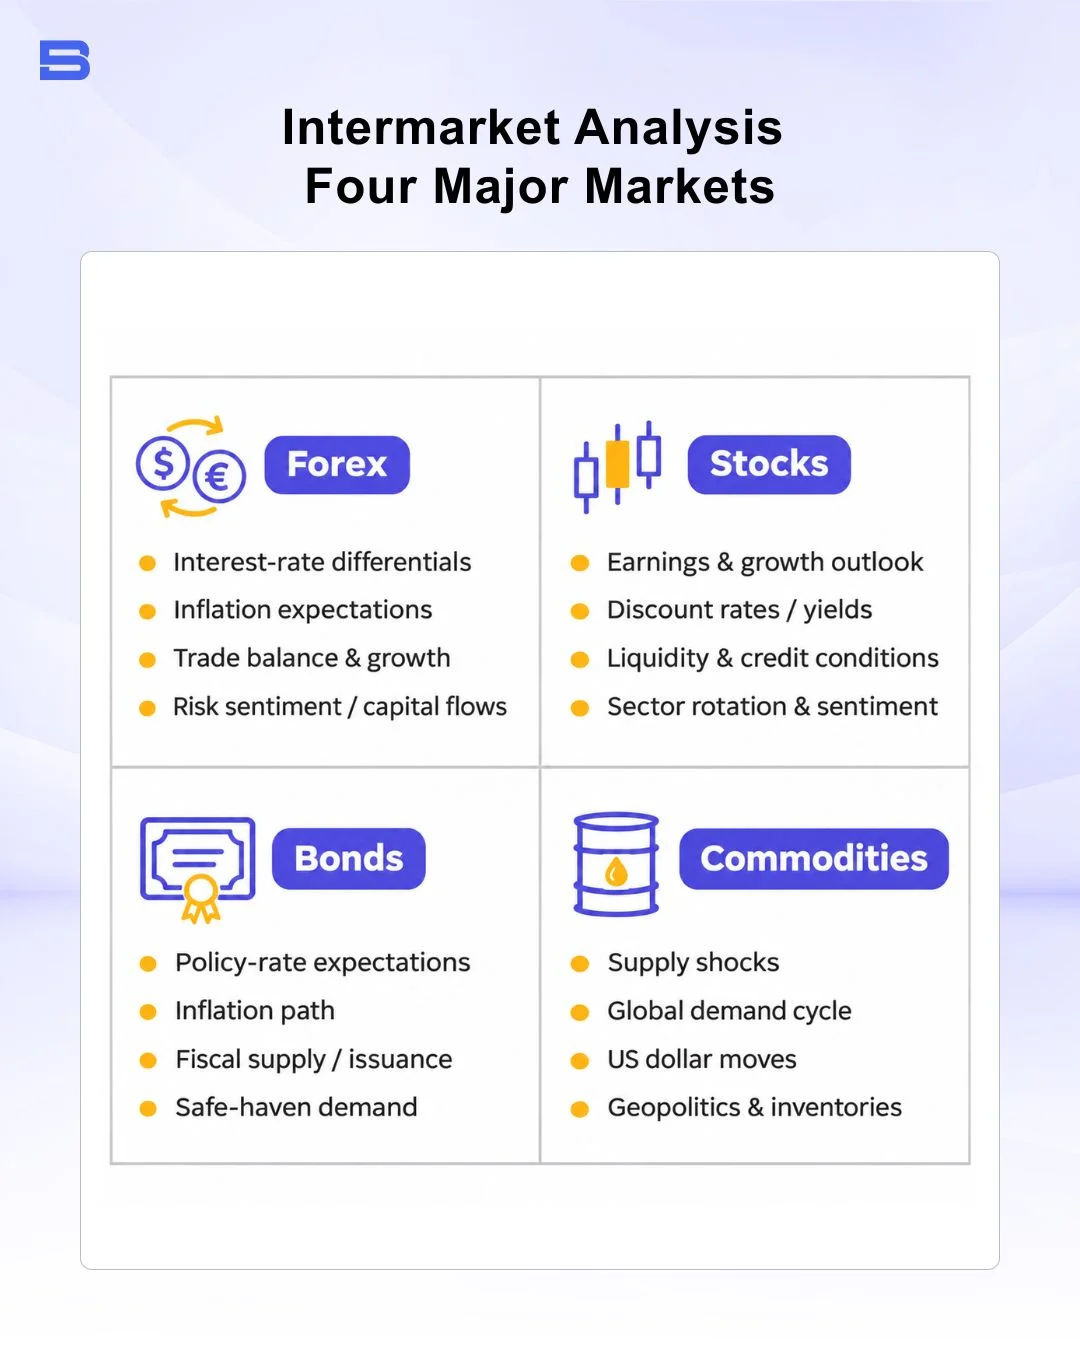
The Four Major Financial Markets in Intermarket Analysis
Institutional macro desks and retail traders monitor four primary asset classes to track capital rotation: currencies, commodities, bonds, and equities. Each pillar serves a functional role in global economic transmission.
When analyzing technical setups, integrating cross-market confirmation often separates valid breaks from traps. For example, confirmation signals often align with price action trading patterns at key technical inflection points, offering contextual backing to pure candlestick setups.
The Relationship Between the US Dollar and Commodities: Pricing Dynamics
Most globally traded commodities, such as Brent crude, gold, and agricultural produce, are denominated in US dollars. When the greenback strengthens, raw materials become more expensive for international purchasers holding local currencies, which suppresses global demand and applies downward pressure on commodity quotes. Conversely, persistent dollar weakness lowers acquisition barriers, frequently supporting commodity rallies.
Traders often map these macro dollar flows into specific currency pairs using forex pair correlation models to identify diverging trends. While tracking inverse currency-commodity dynamics can identify high-probability setups, using high leverage on multi-asset CFD positions can drastically escalate drawdown risks if a sudden liquidity shock drives both the dollar and commodity prices down at the same time.
How Bonds Affect the Stock Market: Cost of Capital and Equity Valuations
Sovereign bond yields establish the risk-free rate of return and determine the benchmark cost of capital for corporate enterprises. When government bond yields rise, future cash flows generated by corporations must be discounted at a higher rate, which mechanically lowers the present value of equity shares.
Rising debt yields also provide conservative capital with an attractive alternative to risky stocks. A company yielding a 4% equity dividend becomes far less appealing when risk-free sovereign debt yields match or exceed that return. However, rising yields driven by genuine economic growth can temporarily coexist with rising stock prices, demonstrating that the bond-equity dynamic is heavily context-dependent.
Reading Cross-Asset Correlation: Leading Indicators vs. Lagging Noise
Intermarket signals rarely arrive simultaneously across all four corners. Historically, bond markets act as the leading early-warning mechanism, reacting quickly to inflation shifts and central bank policy expectations. Copper-to-gold ratios often move alongside bond yields, while stock indices and broad commodity prices typically take longer to reflect the economic shift, with commodities usually turning last.
Institutional desks utilize quantitative overlays such as statistical arbitrage and order flow trading to capture momentary pricing misalignments across these cross-asset channels.
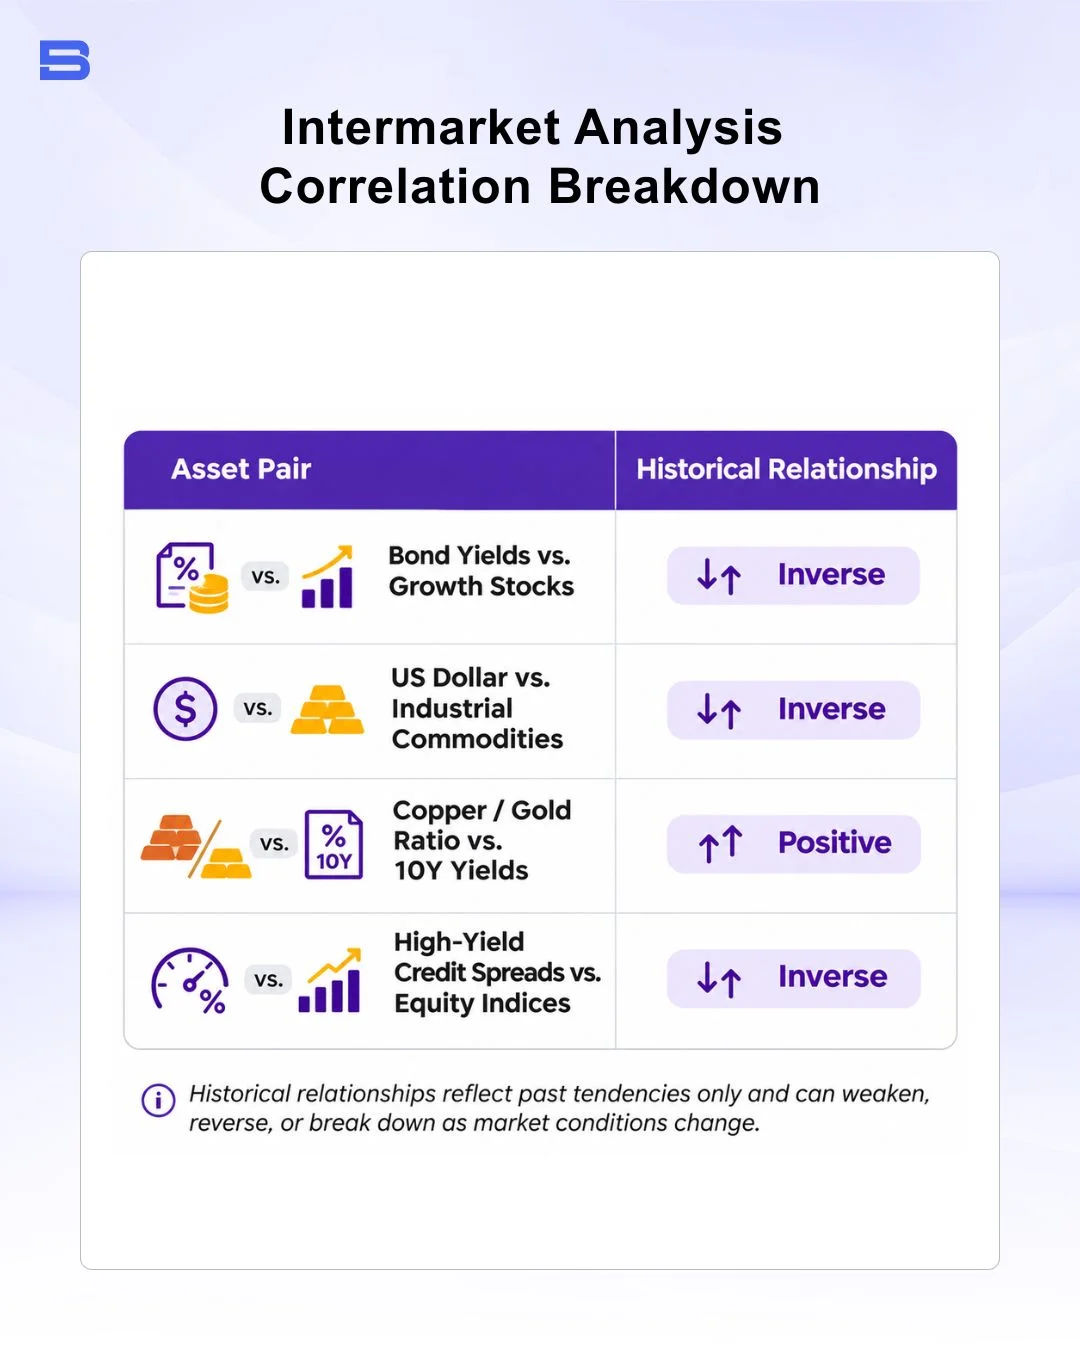
Tracking Business Cycle Rotation Across Global Markets
Long-term market movements generally follow predictable phases of the macroeconomic business cycle. In classic intermarket theory, asset classes reach cyclical turning points in an ordered sequence: bonds peak first as central banks hike rates, followed by equities peaking as borrowing costs bite corporate margins, and commodities peaking last as late-cycle inflation exhausts final demand.
During economic contractions, the reversal occurs: sovereign bonds bottom first as monetary easing begins, equity markets find a floor in anticipation of recovery, and commodities bottom out last when industrial consumption stabilizes. Successful multi-asset traders continuously gauge their investment plan against these rotational stages, adjusting risk budgets as economic indicators shift.
Correlation Breakdown: When Historical Intermarket Links Fail
Relying solely on static historical relationships, without checking whether those intermarket links still hold, can expose traders to significant portfolio risk. Changes in macroeconomic conditions can cause longstanding relationships between asset classes to weaken, decouple, or even reverse entirely, making continuous market monitoring essential for effective risk management.
During supply-side inflation shocks or aggressive quantitative tightening cycles by the US Federal Reserve, equities and bonds can drop simultaneously. Traders who assume bonds will always hedge stock exposure face sudden compounded losses during these regimes. Assuming static cross-market correlations will hold indefinitely exposes your portfolio to accidental duplicate risk, where multiple positions move against you simultaneously and amplify downside losses.
Conclusion
Intermarket analysis provides traders with an essential lens for understanding capital movement across global financial markets. By tracking the fundamental links connecting bonds, currencies, commodities, and equities, you can better navigate shifting macroeconomic trends and protect your capital from unforeseen correlation shocks.
- How to Build an Investment Plan That Actually Works for You?
- What Is the MACD Indicator and How to Use It
- What Is a Wedge Pattern in Trading?
- What Is Ichimoku Cloud Strategy? A Complete Trading System
- Mastering Elliott Wave Theory: Rules and Trading Strategies
- News Trading: Strategies, Execution Risks, and Risk Control
- What Is an Iron Condor Options Strategy?
- Backtesting Explained: What It Is and Why It Really Matters
- Grid Trading: Mechanics, Parameters, and Risk Strategies
- What Is Breakout Trading and How Does It Work?
- Mean Reversion: Technical Strategies and Risk Frameworks
- Momentum Trading: Indicators, Strategies, and Risk Control
- Hammer Candlestick: Structure, Meaning, and Strategy
- Doji Candlestick: Types, Signals, and Trading Strategies
- What Is the Sharpe Ratio and How to Calculate It
- What Is VWAP and How Do Traders Use It?
- Trade the Ascending Triangle: A Step-by-Step Practical Guide
- What Is the Stochastic Oscillator and How to Use It
- How to Trade the Descending Triangle Pattern
- High Frequency Trading: Speed, Algorithms, and Market Impact
- What Is Volume Profile and How to Use It in Trading
- What Is a Morning Star Pattern Candlestick?
- Trade with Parabolic SAR: A Practical Analysis Guide
- Evening Star Pattern: Structure, Rules, and Risk Controls
- Kelly Criterion: Formula, Position Sizing, and Risk
- What Is the NYSE Minimum Trading Price? Rules Explained
Disclaimer: The content on this page is intended for educational and informational purposes only. It does not constitute financial, investment, tax, or legal advice, and should not be interpreted as a recommendation to buy, sell, or hold any financial instrument or asset. Trading and investing involve significant risk, including the possible loss of your entire capital. Products such as forex, CFDs, and cryptocurrencies carry additional risks due to leverage, high volatility, and limited regulatory protection in some jurisdictions. Past performance of any financial instrument does not guarantee future results. Any market views, forecasts, or opinions expressed are those of the author at the time of writing and may not reflect current market conditions. Platform features, fees, and regulatory status are subject to change — always verify information directly with the relevant provider or regulator before making any financial decision. BrokerSpecs may receive compensation from third parties featured on this site. Always conduct your own due diligence and consider seeking advice from a licensed financial professional before investing. Portions of this article were prepared with the assistance of AI tools and reviewed by our editorial team before publication.