


Related Tags
You are tracking a strong bullish rally on your chart, watching prices reach new higher highs. Suddenly, near a major resistance level, a single candle forms with a tiny body and a long lower tail, signaling that heavy selling pressure briefly overwhelmed buyers during the session. This structure is known as the hanging man candlestick pattern, and recognizing its market psychology early can protect your capital from an unexpected trend reversal.
What Is a Hanging Man Candlestick Pattern?
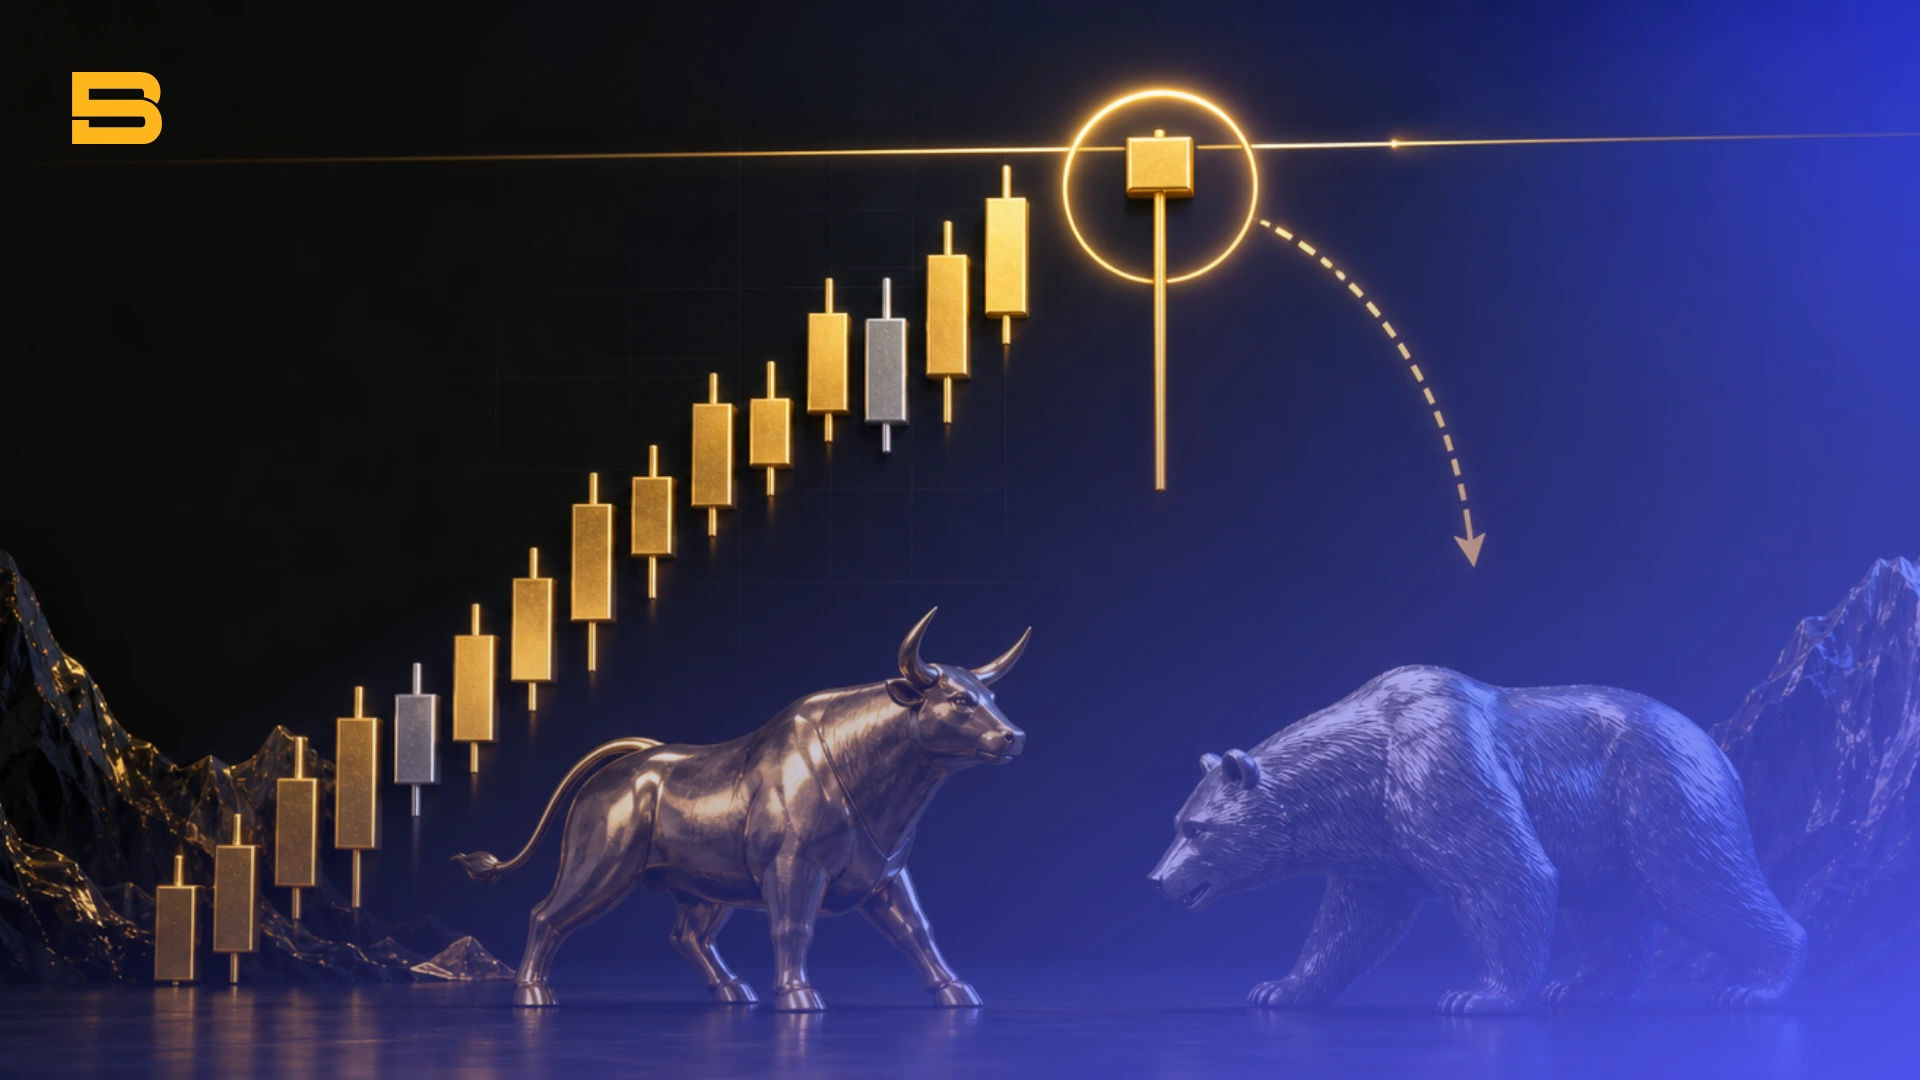
A hanging man candlestick pattern is a single-candle bearish reversal visual that forms after an extended uptrend, characterized by a small real body near the top of the price range and a long lower shadow at least twice its body's length.
When this pattern appears, it reflects an abrupt shift in market sentiment. Buyers start the session in control, but aggressive sellers step in and force prices sharply lower during trading hours. Although buyers manage to push the price back up toward the open before the candle closes, the deep lower shadow proves that institutional supply is entering the market.
To qualify as a valid technical setup under established technical analysis standards, the candle must satisfy precise structural proportions:
- Lower Shadow Length: The lower tail must measure at least 2x to 3x the height of the real body.
- Upper Shadow: The upper shadow should be non-existent or exceptionally small.
- Real Body: The body sits at the top end of the trading range, regardless of whether it closes slightly higher or lower than the open.
What Is the Difference Between Hammer and Hanging Man?
Understanding the difference between a hammer and a hanging man comes down entirely to market context rather than visual shape. Both patterns share identical physical structures — a small body with a long lower shadow — but their placement on a price chart gives them opposite technical implications.
Structural Comparison: Hanging Man vs. Hammer
The table below contrasts the primary operational differences between these two candlestick patterns:
While a hammer forms at market lows to signal seller exhaustion, a hanging man signals that buyers are struggling to maintain control after a prolonged advance.
Does Color Matter? Green vs. Red Hanging Man
While both green and red candles represent valid hanging man structures, the color provides insight into buyer strength. A green hanging man means buyers managed to secure a close slightly above the opening price, showing lingering demand.
Conversely, a red hanging man closes below the opening price, proving that sellers retained total control of the session close. A red candle provides a stronger initial warning of impending downward momentum.
Comparing Hanging Man vs. Shooting Star Candlestick Patterns
Traders often contrast a hanging man with a shooting star candlestick pattern, as both signal bearish fatigue at resistance. A shooting star features a long upper shadow, showing direct price rejection at higher levels.
In contrast, a hanging man features a lower shadow, reflecting an aggressive intraday liquidity probe to the downside. Both warn of potential tops, but the shooting star highlights overhead supply rejection while the hanging man reveals emerging structural weakness.
What Is a Hammer Candlestick Pattern?
A hammer candlestick pattern serves as the bullish mirror image to the hanging man. It occurs exclusively at the bottom of a downtrend, signaling that prices reached a value zone where strong demand entered to absorb selling pressure.
Recognizing a hammer requires evaluating the prior price action on your candlestick charts. If the exact same candle structure appears after ten consecutive bearish sessions, it is a hammer hinting at a bullish bounce. If it appears after ten bullish sessions, it is a hanging man warning of exhaustion.
Traders who study candlestick formations often compare this pattern to a doji candlestick or an engulfing pattern to gauge market transitions. You can also analyze momentum alongside a Marubozu candlestick or a morning star pattern to confirm broader market turns.
Why a Confirmation Candle Is Essential Before Entry
A hanging man candlestick pattern is a warning indicator, not a direct command to open a short trade. Entering a short position immediately upon the close of the hanging man candle exposes your portfolio to substantial risk, as strong uptrends frequently produce temporary intraday dips before continuing higher.
A hanging man confirmation candle is the subsequent candle that verifies sellers have taken control of the market. To validate the setup, the confirmation candle must close below the real body or the lower shadow low of the hanging man candle.
Volume Expansion and Technical Confluence
Trading success increases when you combine candlestick geometry with broader technical confluence. Key confirmation factors include:
- Volume Expansion: High trading volume on the confirmation candle validates that institutional capital is actively distributing assets.
- Horizontal Resistance: The pattern holds greater reliability when forming at key multi-month resistance levels or Fibonacci expansion zones.
- RSI Divergence: An overbought Relative Strength Index (RSI) exhibiting bearish divergence reinforces the reversal bias.
Consider a worked scenario on EUR/USD: the pair rallies into major horizontal resistance at 1:1000 and forms a hanging man candle on average volume. The following session opens, attempts a minor rally, and then breaks down to close 30 pips below the hanging man's low on high volume expansion. This 30-pip bearish confirmation close completes the technical setup for execution.
Risk Management and Trade Execution
Disciplined trade management is vital when trading technical reversal setups, as false breakouts can occur in strongly trending markets.
Stop-Loss Placement and Risk Management
Proper hanging man stop-loss placement requires placing your protective stop slightly above the high of the hanging man candlestick. This invalidation level ensures that if buyers regain control and break the high, your trade closes automatically with a small, manageable loss.
Risk management guidelines established by international regulatory frameworks emphasize limiting single-trade risk to a small fraction of capital. You should calculate your position sizing so that the distance between your entry price and stop-loss level represents no more than 1% to 2% of your account balance.
Leverage amplifies your returns when you are right, but it accelerates capital destruction just as quickly when the market turns against you — a sharp breakout above resistance on a 30:1 leveraged short trade can rapidly liquidate your available margin. Incorporating structured capital preservation into your broader investment plan helps keep losses contained.
Using the Hanging Man As a Warning Signal
The hanging man candlestick pattern serves as a powerful early warning signal that an uptrend is losing momentum and heading toward exhaustion. By waiting for a bearish confirmation candle, combining the setup with volume expansion and resistance levels, and maintaining strict stop-loss discipline, you can effectively manage risk while navigating trend reversals.
- How to Build an Investment Plan That Actually Works for You?
- What Is the MACD Indicator and How to Use It
- What Is a Wedge Pattern in Trading?
- What Is Ichimoku Cloud Strategy? A Complete Trading System
- Mastering Elliott Wave Theory: Rules and Trading Strategies
- News Trading: Strategies, Execution Risks, and Risk Control
- What Is an Iron Condor Options Strategy?
- Backtesting Explained: What It Is and Why It Really Matters
- Grid Trading: Mechanics, Parameters, and Risk Strategies
- What Is Breakout Trading and How Does It Work?
- Mean Reversion: Technical Strategies and Risk Frameworks
- Momentum Trading: Indicators, Strategies, and Risk Control
- Hammer Candlestick: Structure, Meaning, and Strategy
- Doji Candlestick: Types, Signals, and Trading Strategies
- What Is the Sharpe Ratio and How to Calculate It
- What Is VWAP and How Do Traders Use It?
- Trade the Ascending Triangle: A Step-by-Step Practical Guide
- What Is the Stochastic Oscillator and How to Use It
- How to Trade the Descending Triangle Pattern
- High Frequency Trading: Speed, Algorithms, and Market Impact
- What Is Volume Profile and How to Use It in Trading
- What Is a Morning Star Pattern Candlestick?
- Trade with Parabolic SAR: A Practical Analysis Guide
- Evening Star Pattern: Structure, Rules, and Risk Controls
- Kelly Criterion: Formula, Position Sizing, and Risk
- What Is the NYSE Minimum Trading Price? Rules Explained
Disclaimer: The content on this page is intended for educational and informational purposes only. It does not constitute financial, investment, tax, or legal advice, and should not be interpreted as a recommendation to buy, sell, or hold any financial instrument or asset. Trading and investing involve significant risk, including the possible loss of your entire capital. Products such as forex, CFDs, and cryptocurrencies carry additional risks due to leverage, high volatility, and limited regulatory protection in some jurisdictions. Past performance of any financial instrument does not guarantee future results. Any market views, forecasts, or opinions expressed are those of the author at the time of writing and may not reflect current market conditions. Platform features, fees, and regulatory status are subject to change — always verify information directly with the relevant provider or regulator before making any financial decision. BrokerSpecs may receive compensation from third parties featured on this site. Always conduct your own due diligence and consider seeking advice from a licensed financial professional before investing. Portions of this article were prepared with the assistance of AI tools and reviewed by our editorial team before publication.