


Related Tags
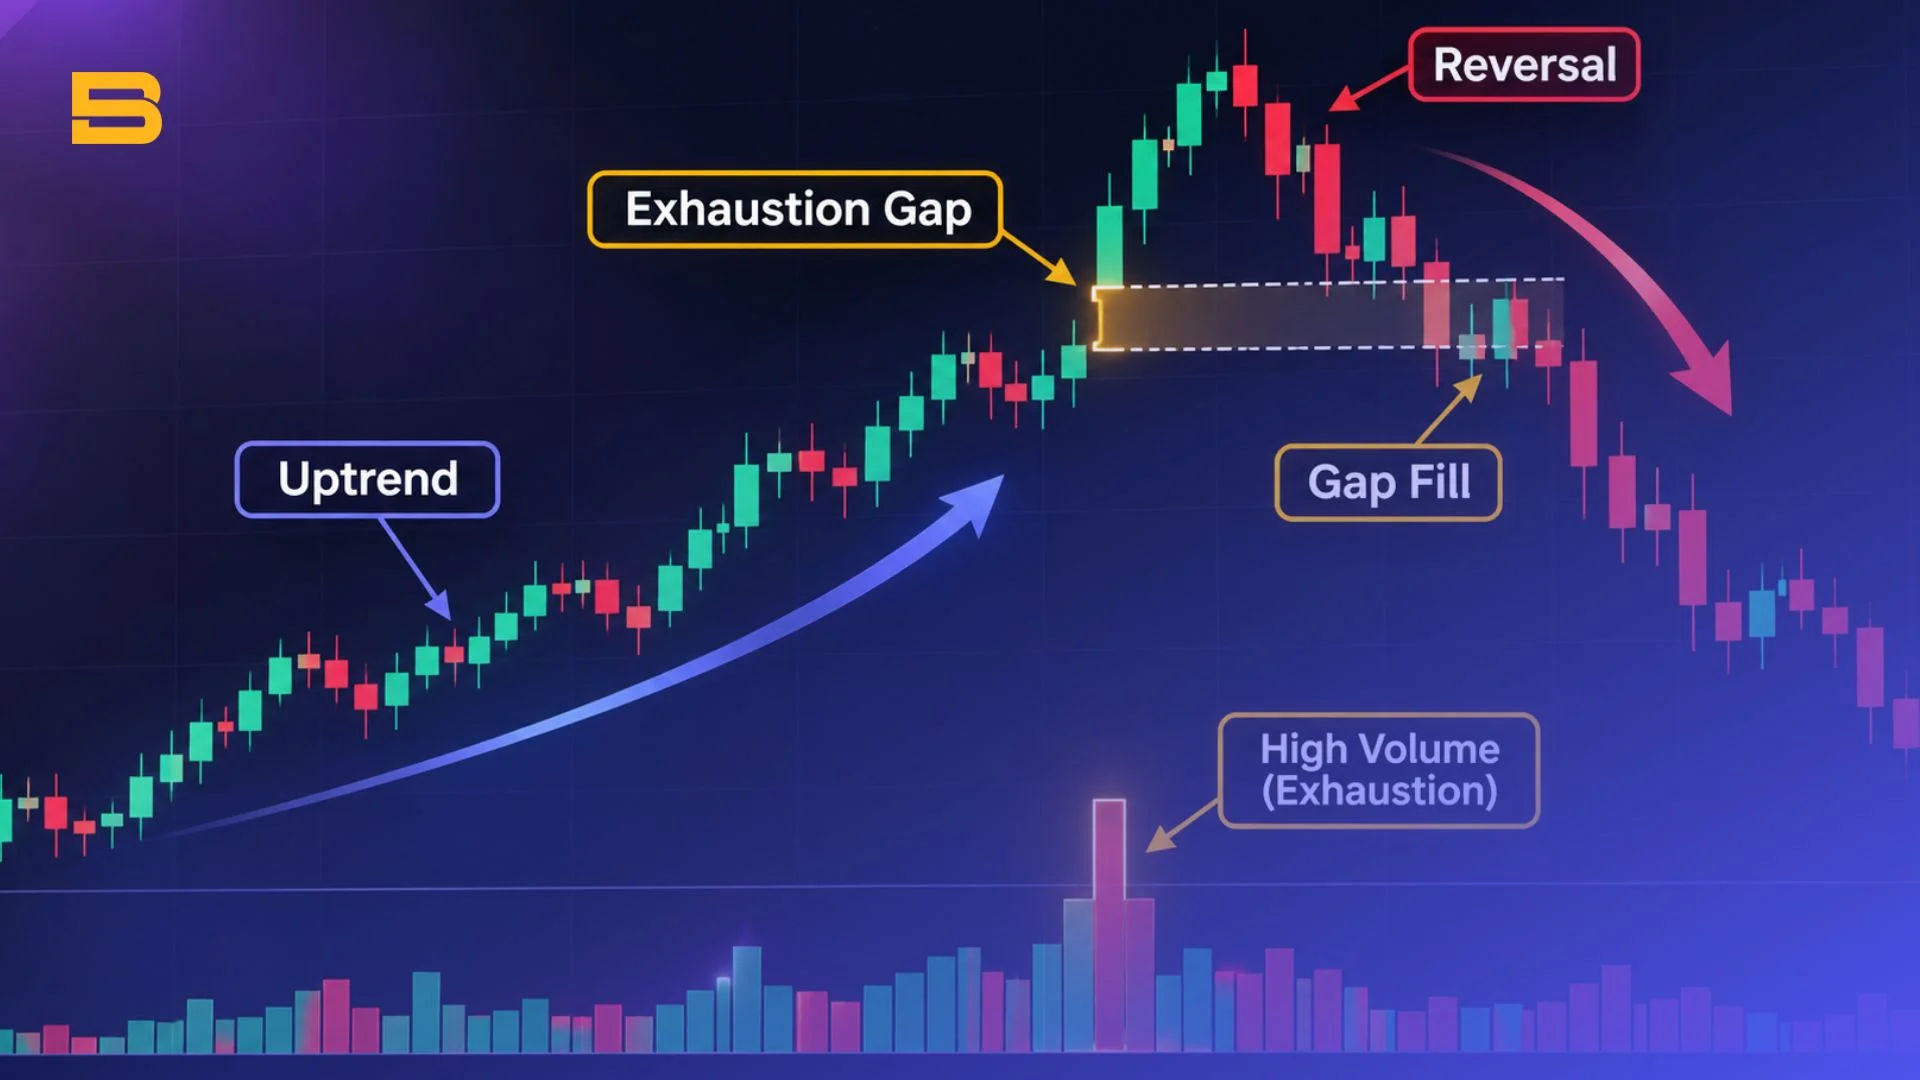
Imagine watching a technology stock climb steadily for six weeks, gaining 35% as headlines grow louder and retail traders rush to join the rally. On Tuesday morning, the stock opens $2.50 above Monday’s close on triple its average volume, only to stall within the first hour and close near the bottom of its daily range. That sudden, high-volume price jump at the tail end of an extended move is often an exhaustion gap, signaling that the prevailing trend may be running out of fuel.
What Is an Exhaustion Gap in Trading?
An exhaustion gap is a sharp price jump occurring near the end of an extended trend that may signal fading momentum and a possible reversal. Unlike continuous intraday price movement, a true gap leaves an empty price zone on a candlestick chart where no shares or contracts traded between one session’s close and the next session’s open.
You will see these gaps most frequently in markets with fixed daily trading sessions, such as equities listed on Bursa Malaysia or the New York Stock Exchange. When earnings releases, macroeconomic announcements, or overnight order imbalances accumulate after the closing bell, the opening auction clears at a markedly higher or lower price. By contrast, 24-hour spot forex markets rarely display true gaps outside of Sunday evening reopenings after weekend geopolitical or economic news.
When price reverses and trades back through that space to reach the prior session’s close, traders say the gap has been “filled.” Filling the gap is a critical confirmation step because it shows the breakout buyers or panic sellers who chased the opening bell are now underwater, suggesting that control may be shifting to the opposite side of the market.
The Market Psychology Behind Exhaustion Gaps
An exhaustion gap is typically driven by emotional capitulation rather than fresh institutional accumulation. In a prolonged uptrend, late-stage buyers who watched from the sidelines finally give in to fear of missing out and place aggressive market orders at the open.
Once those last-wave buyers are filled, almost no new demand remains to push prices higher at those elevated levels. The same dynamic plays out in reverse during a protracted downtrend, where exhausted holders dump shares in a final wave of panic selling at the open, leaving sellers depleted and opening the door for value buyers to step in.
How to Identify an Exhaustion Gap on a Price Chart
Spotting this type of gap requires evaluating the broader market context rather than reacting to a single isolated candle. Institutional technical frameworks, such as those outlined by the CFA Institute, emphasize combining price structure with volume confirmation before acting on a potential reversal:
- An extended prior trend: The gap appears after weeks or months of directional movement, often when price has already stretched far above a rising trendline or key moving average.
- A climactic volume spike: Trading volume on the gap day surges well above its 20-day moving average, reflecting frantic last-minute participation rather than steady institutional buying.
- Immediate intraday rejection: Instead of building on the opening jump, price stalls and forms a bearish reversal candle in an uptrend (or a bullish candle in a downtrend), closing near the opposite extreme of the day’s range.
- A rapid gap fill: Within a few sessions, price retraces completely across the empty gap zone, invalidating the opening surge and suggesting that the prior trend may have lost control.
Evaluating these four elements together helps separate genuine reversal setups from routine overnight price adjustments within broader chart patterns.
Related Gap Formations to Watch
Sometimes a price gap does not fill immediately, and price consolidates in a tight range for several days above the gap before gapping downward in the opposite direction. This two-gap sequence strands the intervening candles on their own, creating an island reversal pattern.
When an island reversal forms on heavy volume, it reinforces the exhaustion signal because every trader who bought during that isolated cluster is trapped at a loss.
Exhaustion Gap vs. Runaway Gap: How to Tell Them Apart
One of the hardest challenges in gap analysis is distinguishing an exhaustion gap from a runaway gap in real time. When both gaps appear in the morning, they look nearly identical: price leaps in the direction of the existing trend, leaving a space on the chart.
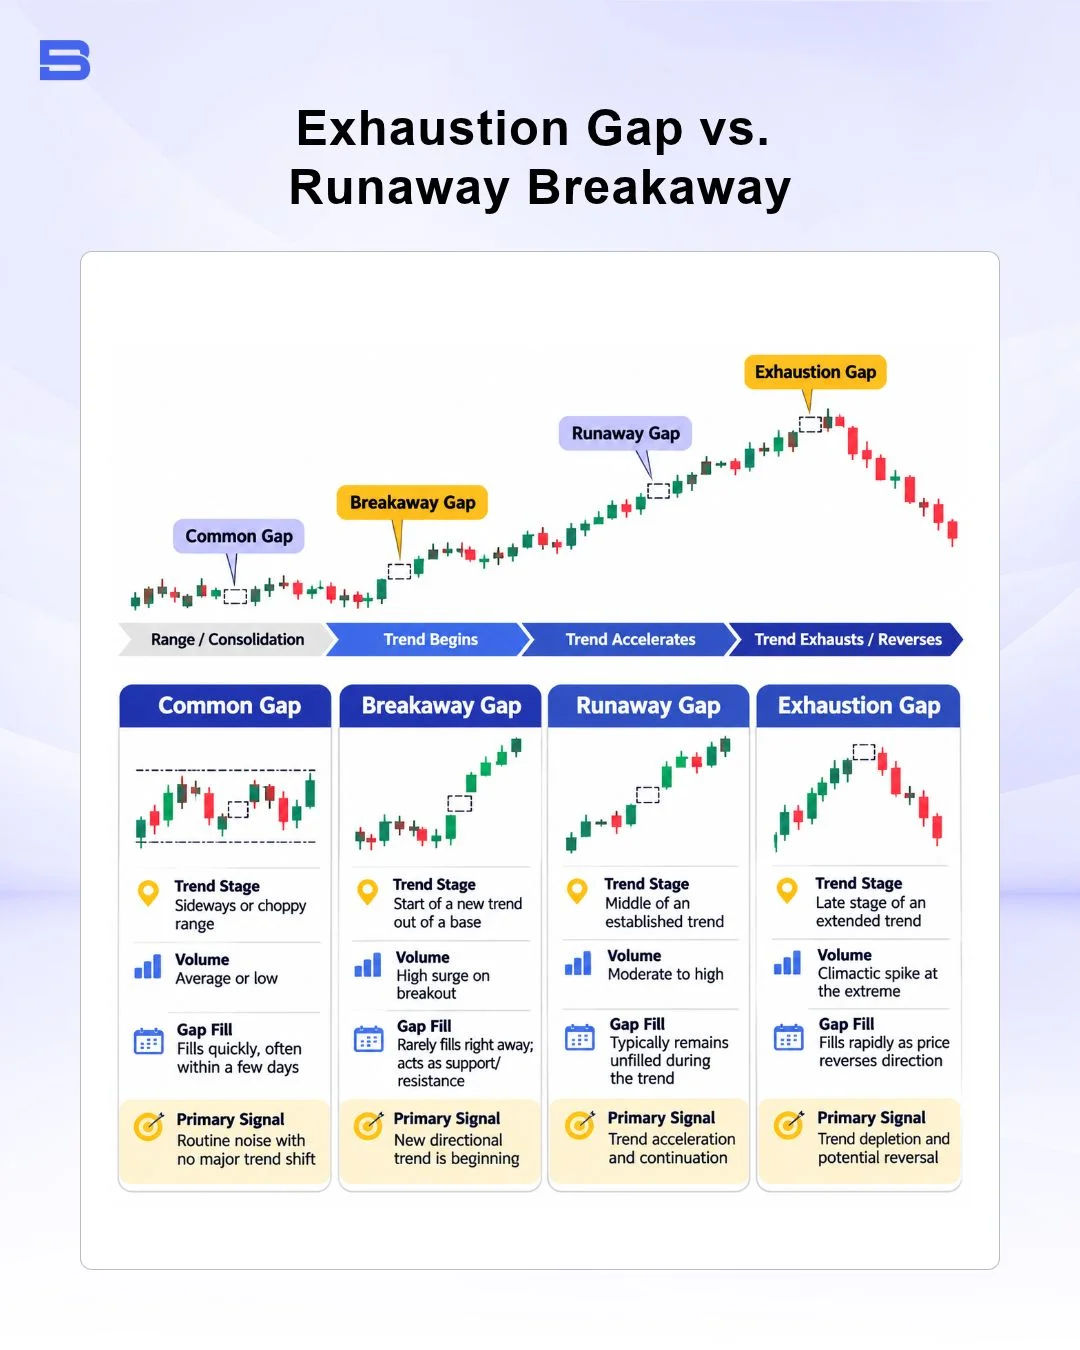
A breakaway gap occurs right as price escapes a consolidation range on rising volume, launching a new move. A runaway gap (also called a measuring gap) appears roughly halfway through a healthy trend on solid, sustainable volume, signaling that momentum is accelerating rather than dying.
By contrast, an exhaustion gap strikes after a prolonged, steep advance or decline where price is already overextended. If volume hits an extreme climax on the gap day but price fails to follow through over the next two to three sessions, the odds shift toward exhaustion rather than continuation.
How to Trade an Exhaustion Gap: Confirmation and Risk Management
Jumping into a counter-trend trade the moment a stock gaps up is one of the fastest ways to take avoidable losses. If a suspected exhaustion gap turns out to be a runaway gap, strong momentum can carry price sharply higher and trap early short sellers in a bear trap, or punish premature dip-buyers in a bull trap during a downtrend.
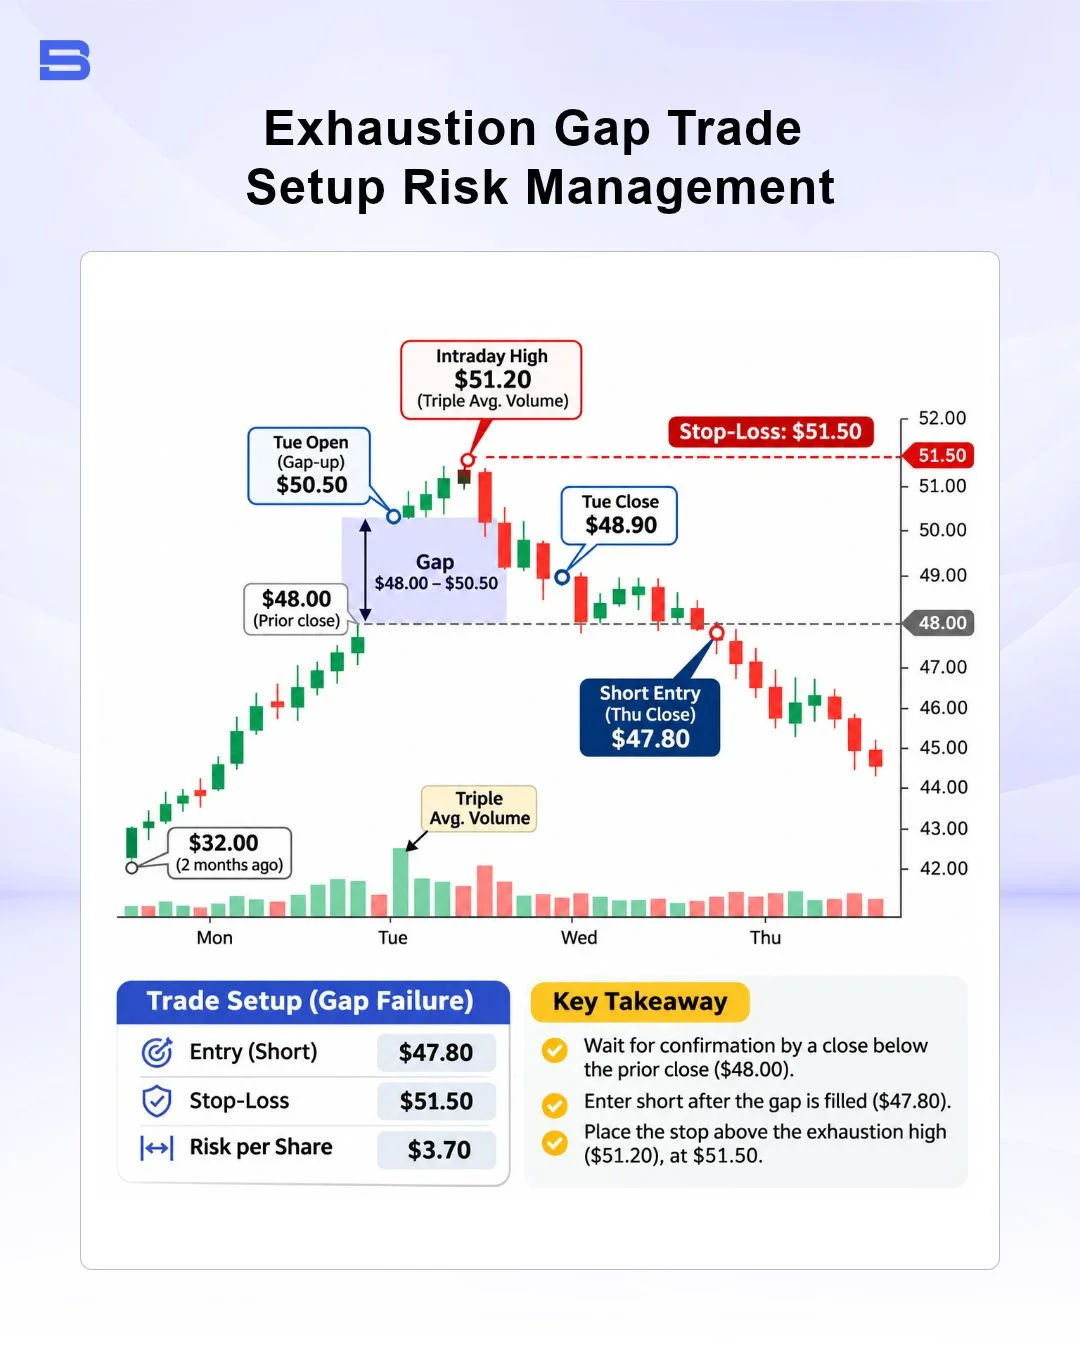
A more disciplined approach is to wait for the market to prove the gap is failing by closing back below the prior session’s closing price. Consider a hypothetical stock that rallies from $32.00 to $48.00 over two months, then gaps up at Tuesday’s open to $50.50, touches an intraday high of $51.20 on triple average volume, and closes Tuesday at $48.90.
Instead of shorting Tuesday’s open, you wait for confirmation. On Thursday, selling pressure pushes the stock down to close at $47.80, filling the gap between $48.00 and $50.50.
You enter a short position at $47.80 and place a protective stop-loss at $51.50, just above the $51.20 exhaustion high. Your risk per share is $3.70 ($51.50 minus $47.80), so on a $10,000 account risking 1% ($100 maximum loss), you limit your position size to 27 shares ($100 divided by $3.70).
Short selling a stock usually requires a margin account, and your broker may charge borrowing fees, commissions, and margin interest while the position stays open. Factor these costs into your risk per share, and keep in mind that if price rises sharply, losses on a short position can exceed what you planned.
Keep in mind that overnight gaps introduce execution risk that standard intraday setups do not carry, as highlighted in US Securities and Exchange Commission (SEC) investor bulletins on market volatility and order execution. Even with a stop-loss order in place, a sudden overnight news event can cause price to gap past your stop level, resulting in slippage and a larger dollar loss than planned.
The Bottom Line
An exhaustion gap is a high-volume warning sign that a mature trend may be running out of momentum, not a standalone signal to fade the market blindly. Waiting for the gap to fill, sizing your position around a clear stop-loss above the extreme, and accounting for overnight slippage risk give you a structured way to trade potential reversals without guessing the top or bottom.
- How to Build an Investment Plan That Actually Works for You?
- What Is the MACD Indicator and How to Use It
- What Is a Wedge Pattern in Trading?
- What Is Ichimoku Cloud Strategy? A Complete Trading System
- Mastering Elliott Wave Theory: Rules and Trading Strategies
- News Trading: Strategies, Execution Risks, and Risk Control
- What Is an Iron Condor Options Strategy?
- Backtesting Explained: What It Is and Why It Really Matters
- Grid Trading: Mechanics, Parameters, and Risk Strategies
- What Is Breakout Trading and How Does It Work?
- Mean Reversion: Technical Strategies and Risk Frameworks
- Momentum Trading: Indicators, Strategies, and Risk Control
- Hammer Candlestick: Structure, Meaning, and Strategy
- Doji Candlestick: Types, Signals, and Trading Strategies
- What Is the Sharpe Ratio and How to Calculate It
- What Is VWAP and How Do Traders Use It?
- Trade the Ascending Triangle: A Step-by-Step Practical Guide
- What Is the Stochastic Oscillator and How to Use It
- How to Trade the Descending Triangle Pattern
- High Frequency Trading: Speed, Algorithms, and Market Impact
- What Is Volume Profile and How to Use It in Trading
- What Is a Morning Star Pattern Candlestick?
- Trade with Parabolic SAR: A Practical Analysis Guide
- Evening Star Pattern: Structure, Rules, and Risk Controls
- Kelly Criterion: Formula, Position Sizing, and Risk
- What Is the NYSE Minimum Trading Price? Rules Explained
Disclaimer: The content on this page is intended for educational and informational purposes only. It does not constitute financial, investment, tax, or legal advice, and should not be interpreted as a recommendation to buy, sell, or hold any financial instrument or asset. Trading and investing involve significant risk, including the possible loss of your entire capital. Products such as forex, CFDs, and cryptocurrencies carry additional risks due to leverage, high volatility, and limited regulatory protection in some jurisdictions. Past performance of any financial instrument does not guarantee future results. Any market views, forecasts, or opinions expressed are those of the author at the time of writing and may not reflect current market conditions. Platform features, fees, and regulatory status are subject to change — always verify information directly with the relevant provider or regulator before making any financial decision. BrokerSpecs may receive compensation from third parties featured on this site. Always conduct your own due diligence and consider seeking advice from a licensed financial professional before investing. Portions of this article were prepared with the assistance of AI tools and reviewed by our editorial team before publication.