



Related Tags
You place a buy order right at a textbook support line, set your stop just below the swing low, and watch the price dip just enough to tag your stop before rocketing into your profit target. That frustrating pattern happens because standard support and resistance levels often become magnets for capital rather than impenetrable barriers. The smart money concept seeks to explain why these sudden reversals happen by analyzing where major financial institutions source the liquidity required to fill massive positions.
What Is the Smart Money Concept (SMC)?
Smart Money Concept (SMC) is an analytical trading framework that interprets chart patterns through the lens of institutional order flow and market liquidity. Rather than relying on lagging indicators, SMC focuses on how banks, institutional funds, and market makers accumulate and distribute inventory.
According to data from the Bank for International Settlements (BIS), global foreign exchange turnover reaches trillions of dollars each day. Institutions moving billions cannot simply click buy or sell without causing severe slippage against their own orders.
To build large positions efficiently, they must source resting counterpart orders, which naturally cluster above swing highs and below swing lows. SMC provides a structured vocabulary to track these institutional footprints across your charts.
Order Block Trading: Identifying Institutional Footprints
Order block trading focuses on the specific candles where institutional volume originally displaced the market. A bullish order block represents the final down-close candle before an aggressive upward impulse that breaks market structure.
When price eventually retraces to this origin point, traders anticipate institutional defense. However, an order block serves as a high-probability reaction area rather than an absolute guarantee that price will hold.
Fair Value Gap (FVG) and Imbalance
A fair value gap occurs during aggressive directional displacement across a three-candle sequence. When the wick of candle one and the wick of candle three do not overlap, they leave an inefficient pricing pocket in candle two.
SMC traders treat this imbalance as an internal target because price often retraces to restore equilibrium before resuming its original trend. In runaway market conditions, some imbalances can remain unfilled for long periods.
Market Structure Trading: The SMC Foundation
Successful SMC analysis relies heavily on multi-timeframe market structure trading. Rather than treating every candle equally, you map high-timeframe narrative from the daily or 4-hour chart down to 15-minute or 5-minute execution levels.
Market microstructure standards established by the CFA Institute emphasize that liquidity conditions shift across continuous trading sessions. SMC organizes these shifts into an ongoing cycle of liquidity accumulation, energetic displacement, and structural mitigation.
Break of Structure (BOS) in Trend Continuation
A break of structure occurs when price closes with a full candle body beyond a previous significant swing high in an uptrend or swing low in a downtrend. This confirms that institutional momentum remains aligned with the prevailing trend. Wicks that pierce a high without closing above it suggest exhaustion rather than genuine continuation.
Change of Character (CHoCH) vs. BOS
A change of character represents an early warning sign that directional control is shifting. Unlike a standard BOS that confirms an existing trend, a CHoCH happens when price breaches the swing level responsible for the most recent structural impulse. Because lower-timeframe shifts frequently produce false signals during higher-timeframe pullbacks, traders wait for order block confirmation before executing reversals.
Liquidity Sweeps and Stop Hunts
Institutional algorithms require substantial counter-liquidity to fill large orders. Obvious chart patterns like double tops accumulate buy-side liquidity from breakout buyers and protective stop-losses. A liquidity sweep occurs when price pierces these obvious levels to capture resting volume before immediately reversing in the opposite direction.
Inducement in Trading: How Retail Traps Form
Inducement refers to short-term swing highs or lows created just ahead of a major point of interest. These minor swings tempt impatient traders into premature entries. Once retail capital commits to the minor setup, institutional flow pushes price through those positions to tap the true underlying order block.
Step-by-Step SMC Trading Strategy and Entry Checklist
Executing a systematic SMC trading strategy requires disciplined confirmation across multiple timeframes. You start by determining the 4-hour trend, identifying unmitigated order blocks, and waiting for lower-timeframe confirmation before entering.
Consider a practical example on EUR/USD. The 4-hour chart shows a confirmed downtrend, and price retraces upward into a 4-hour bearish order block at 1.0850 during the London session open. On the 5-minute chart, price sweeps the Asian session high at 1.0860, prints a clear change of character downward, and leaves a 5-minute fair value gap at 1.0845.
On a $10,000 account, you risk 1% ($100) on this trade setup. You place a limit sell order at 1.0845 with a stop-loss at 1.0865 (20 pips) and target the previous session low at 1.0765 (80 pips). Calculating your position size at $5 per pip yields 0.5 mini lots.
When price fills the order and reaches the target, you realize a $400 gain, achieving a 1:4 risk-reward ratio. Having an exact invalidation level protects your capital if the structural thesis fails.
Premium and Discount Zones for Value Entries
To avoid entering at disadvantageous prices, SMC traders split any dealing range into halves using the 50% equilibrium level. In a bullish market, you seek buy entries strictly in discount territory below 50%, often targeting the 61.8% to 78.6% optimal trade entry zone. Selling in premium and buying in discount prevents chasing extended moves.
Liquidity Grab vs. Genuine Breakouts
Distinguishing a liquidity grab from a genuine breakout comes down to candle closes and volume follow-through. A liquidity grab features long wicks that briefly violate a key level before snapping back into the prior range. In contrast, genuine breakouts produce aggressive candle bodies that close and hold beyond key structural levels.
Using a Smart Money Concept Indicator for Chart Mapping
Automated indicator scripts on modern platforms can map structural swings, order blocks, and imbalances in real time. These tools help maintain objective chart analysis, especially when fatigue sets in. However, indicators cannot interpret market context or upcoming economic catalysts, so you should use them as visual aids rather than automated trade triggers.
Comparing SMC with Classic Supply and Demand Trading
Many traders wonder whether SMC is entirely revolutionary or simply classical methodology repackaged with modern terminology. In practice, the mechanics of SMC share deep roots with traditional price action trading and supply and demand trading. Both approaches seek to identify where large imbalances between buyers and sellers occurred in the past.
The primary distinction lies in how zones are refined and entered. Traditional supply and demand often uses wider candle clusters and broad limit orders across entire zones. SMC refines these zones down to specific imbalances and demands lower-timeframe structural confirmation, such as a change of character, before capital is committed.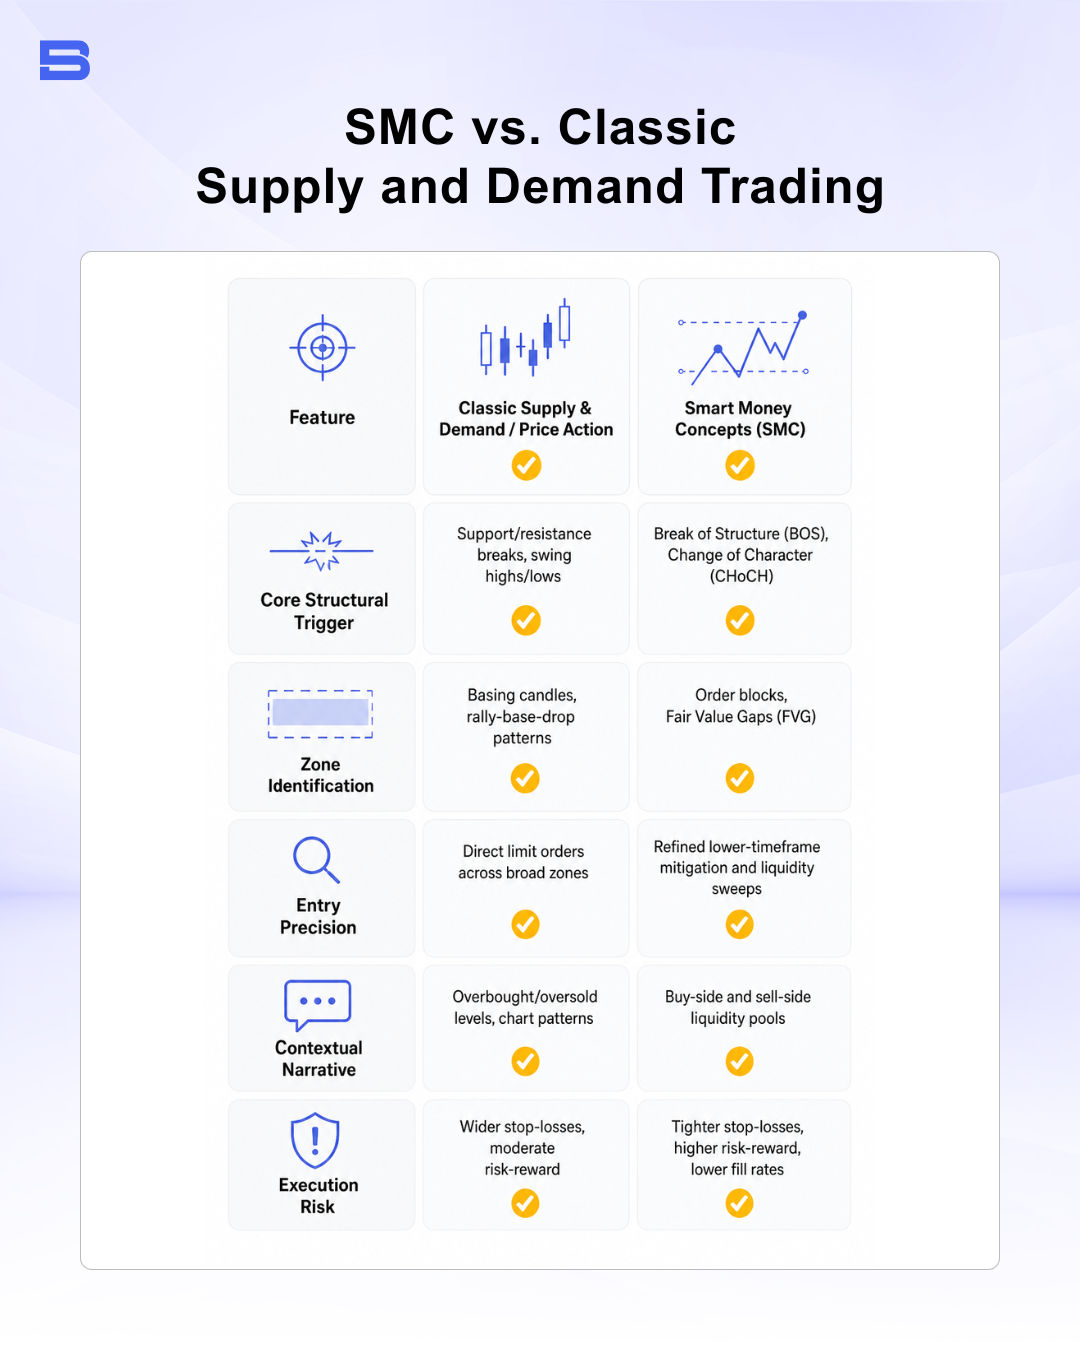
The Reality of Risk: Drawdowns, Win Rates, and Execution Flaws
While social media marketing often highlights outsized risk-to-reward ratios, practical SMC trading comes with clear downsides that require disciplined management. Tightly refined entries frequently lead to a lower hit rate than looser entry methods, since waiting for precise confirmation means more setups are missed or invalidated before they trigger.
Execution friction also presents a major challenge in live market conditions. Setting aggressive limit orders inside narrow fair value gaps means you will frequently miss trades by fractions of a pip during rapid news events.
Furthermore, leveraged contracts amplify capital destruction just as swiftly as they multiply gains during profitable runs. According to risk disclosures mandated by the Financial Conduct Authority (FCA), between 70% and 80% of retail investor accounts lose money when trading leveraged derivatives.
Before adopting any advanced institutional methodology, evaluating your personal risk tolerance and establishing a clear investment plan remains essential for long-term survival.
Applying Smart Money Concepts With Realistic Expectations
Smart money concepts offer a valuable framework for understanding why market prices sweep key levels before establishing strong trends. However, no analytical system guarantees market outcomes. Long-term success ultimately depends on consistent execution, patient trade selection, and strict downside capital preservation.
- How to Build an Investment Plan That Actually Works for You?
- What Is the MACD Indicator and How to Use It
- What Is a Wedge Pattern in Trading?
- What Is Ichimoku Cloud Strategy? A Complete Trading System
- Mastering Elliott Wave Theory: Rules and Trading Strategies
- News Trading: Strategies, Execution Risks, and Risk Control
- What Is an Iron Condor Options Strategy?
- Backtesting Explained: What It Is and Why It Really Matters
- Grid Trading: Mechanics, Parameters, and Risk Strategies
- What Is Breakout Trading and How Does It Work?
- Mean Reversion: Technical Strategies and Risk Frameworks
- Momentum Trading: Indicators, Strategies, and Risk Control
- Hammer Candlestick: Structure, Meaning, and Strategy
- Doji Candlestick: Types, Signals, and Trading Strategies
- What Is the Sharpe Ratio and How to Calculate It
- What Is VWAP and How Do Traders Use It?
- Trade the Ascending Triangle: A Step-by-Step Practical Guide
- What Is the Stochastic Oscillator and How to Use It
- How to Trade the Descending Triangle Pattern
- High Frequency Trading: Speed, Algorithms, and Market Impact
- What Is Volume Profile and How to Use It in Trading
- What Is a Morning Star Pattern Candlestick?
- Trade with Parabolic SAR: A Practical Analysis Guide
- Evening Star Pattern: Structure, Rules, and Risk Controls
- Kelly Criterion: Formula, Position Sizing, and Risk
- What Is the NYSE Minimum Trading Price? Rules Explained
Disclaimer: The content on this page is intended for educational and informational purposes only. It does not constitute financial, investment, tax, or legal advice, and should not be interpreted as a recommendation to buy, sell, or hold any financial instrument or asset. Trading and investing involve significant risk, including the possible loss of your entire capital. Products such as forex, CFDs, and cryptocurrencies carry additional risks due to leverage, high volatility, and limited regulatory protection in some jurisdictions. Past performance of any financial instrument does not guarantee future results. Any market views, forecasts, or opinions expressed are those of the author at the time of writing and may not reflect current market conditions. Platform features, fees, and regulatory status are subject to change — always verify information directly with the relevant provider or regulator before making any financial decision. BrokerSpecs may receive compensation from third parties featured on this site. Always conduct your own due diligence and consider seeking advice from a licensed financial professional before investing. Portions of this article were prepared with the assistance of AI tools and reviewed by our editorial team before publication.