



Related Tags
You sit in front of your monitors during a major economic release, watching an aggressive candle surge upward without pause. It cuts through multiple price levels in seconds, leaving an empty pocket on your chart where normal two-way trading never took place.
This structural price imbalance is what technical traders refer to as a fair value gap, a concept from the Inner Circle Trader (ICT) methodology. Understanding why these pockets form helps you evaluate whether price is moving with institutional backing or simply hunting retail stops.
What Is a Fair Value Gap and How Does It Form?
A fair value gap is a three-candle technical pattern where aggressive one-sided order flow creates a price imbalance between non-neighboring wicks.
In an efficient market, buyers and sellers negotiate every tick in a balanced manner. When large institutional market orders enter the order book, they consume all available liquidity at surrounding quotes, causing prices to jump rapidly across multiple price levels.
This concept stems from the broader smart money concept (a framework that analyzes how large institutions influence price) and shares similarities with classical supply and demand trading. According to data tracked by the Bank for International Settlements (BIS), global foreign exchange turnover averaged $9.6 trillion per day in April 2025, meaning large capital surges can displace price before liquidity providers can restock quotes.
When aggressive buying creates a sudden price leap, only buyers get filled, leaving sell orders in that zone temporarily unfilled. Market mechanics dictate that price frequently retraces toward these inefficiencies to facilitate two-way trade, although return is never certain. In ICT theory, a sudden displacement is often described as following a liquidity grab, where large participants are believed to trigger clusters of retail stops before driving the market forward.
How to Identify a Fair Value Gap Using 3 Candles
Identifying this imbalance requires isolating a specific three-candle sequence on your charting platform. You must look for a central displacement bar bordered by two adjacent candles whose wicks do not overlap.
Candle 1 establishes the baseline high or low prior to the displacement. Candle 2 represents the expansive impulse move, characterized by a long, wide body that reflects heavy volume and aggressive execution.
Candle 3 completes the formation as price pauses or pulls back slightly. If a visible vacuum remains between the wick of Candle 1 and the wick of Candle 3, that unfilled zone is your active gap.
Bullish vs Bearish Fair Value Gap
Fair value gaps develop in both market directions, reflecting either pure buy-side imbalance or aggressive sell-side delivery. The structural rules remain identical, but your entry triggers and risk expectations invert depending on the directional bias.
The table below outlines how each setup forms and how price typically interacts with the open zone:
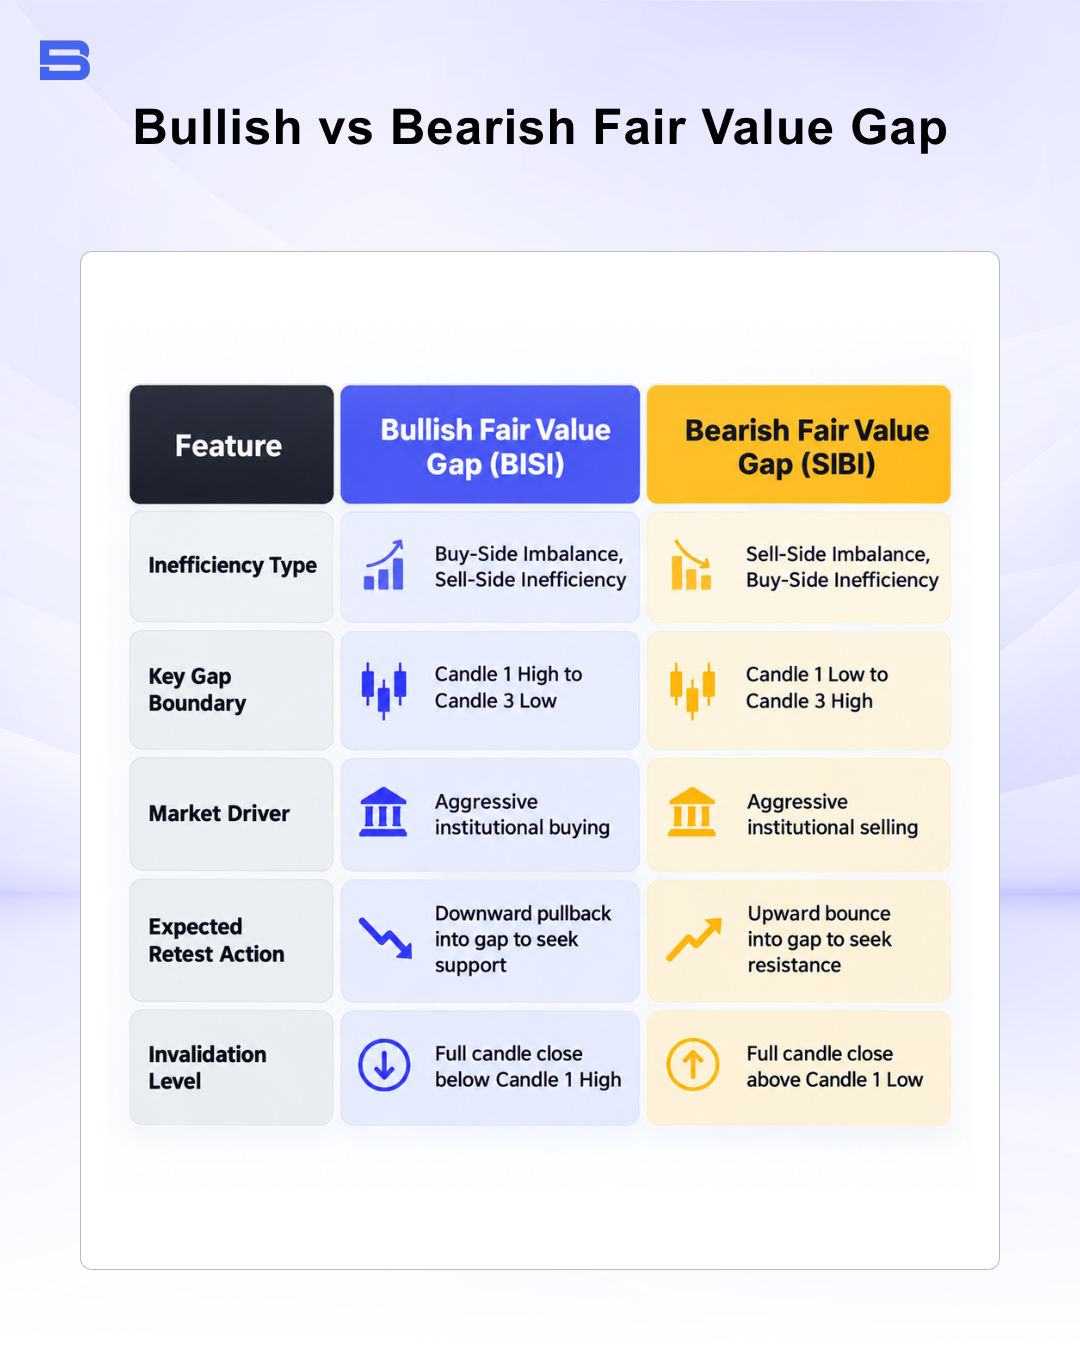
A bullish gap serves as a potential support pocket where buyers may re-enter during an established uptrend. Conversely, a bearish gap acts as an overhead ceiling where sellers might defend positions during an ongoing markdown.
Step-by-Step Fair Value Gap Example on a Candlestick Chart
Examining a concrete setup demonstrates how this price dynamic unfolds in active market conditions. Consider a hypothetical 15-minute chart on EUR/USD following the London market open. The prices below are illustrative, not real market data.
Candle 1 reaches a swing high of 1.0830 before closing. Candle 2 then surges from 1.0820 up to 1.0860 on heavy volume, creating a large green body. Candle 3 attempts a slight downward pullback, but its session low reaches only 1.0845 before buying resumes.
The gap spans the 15-pip vacuum between the Candle 1 high (1.0830) and the Candle 3 low (1.0845). If you anticipate institutional defense of this zone, an entry order is placed at 1.0845 as price retraces.
A protective stop-loss sits below Candle 1 at 1.0815, risking 30 pips against an upside target of 1.0905 to secure a 1:2 risk-to-reward ratio. If price slices entirely through 1.0830 without slowing down, the setup is invalidated immediately and your defined risk limits the loss.
Fair Value Gap Trading Strategies and Entry Confluence
Relying on an isolated price imbalance rarely yields consistent results across varying market conditions. Professional execution requires combining gap boundaries with higher-timeframe trend confirmation and clear order flow triggers.
When planning fair value gap trading, you can enter at the initial boundary or wait for price to reach the 50% midpoint, known as consequent encroachment. Entering at the midpoint offers a tighter stop-loss and an improved risk-to-reward ratio, but strong trends may run without giving you a full fill.
Confluence may increase when an imbalance aligns with order block zones (the last opposing candle before a strong move) or follows a confirmed break of structure (price moving beyond the previous swing high in an uptrend or below the previous swing low in a downtrend), although no combination of signals removes the risk of loss. Aligning your trade with higher-timeframe market structure prevents you from buying into a gap that is counter to the dominant trend.
When trading FVG in forex, major session opens such as London and New York may offer deeper liquidity than other sessions. High-volatility session openings can widen spreads and cause fast price jumps, so limit orders may not fill and stop-loss orders may execute at a worse price than planned.
Why Fair Value Gaps Fail and Key Risks to Manage
Every technical pattern carries a tangible failure rate, and fair value gaps fail frequently during sustained market moves. Strong trending environments often leave unfilled gaps behind for weeks, trapping counter-trend traders who attempt to fade runaway momentum.
A gap may fail when it acts as an inducement, which ICT theory describes as price stalling briefly inside a minor imbalance to attract retail capital before reversing lower. If market price closes decisively beyond the outer boundary of Candle 1, the gap is structurally invalidated and must be abandoned.
Leverage amplifies your returns when price respects your setup, but it accelerates capital destruction just as quickly when an imbalance fails, meaning an unexpected news spike can wipe out a large share of your margin. Placing a fixed stop-loss outside the structural swing point remains essential to prevent catastrophic drawdowns.
Retail leveraged trading carries significant risk of loss, and a technical imbalance gives no assurance that price will reverse. You must prioritize disciplined position sizing over the assumption that every gap must eventually close.
Treating Fair Value Gaps as Points of Interest
Fair value gaps offer a structured method for reading institutional order flow and spotting price inefficiencies on your charts. However, treat them as points of interest rather than mechanical entry triggers, and always ground your execution in strict risk limits and verified market context.
- How to Build an Investment Plan That Actually Works for You?
- What Is the MACD Indicator and How to Use It
- What Is a Wedge Pattern in Trading?
- What Is Ichimoku Cloud Strategy? A Complete Trading System
- Mastering Elliott Wave Theory: Rules and Trading Strategies
- News Trading: Strategies, Execution Risks, and Risk Control
- What Is an Iron Condor Options Strategy?
- Backtesting Explained: What It Is and Why It Really Matters
- Grid Trading: Mechanics, Parameters, and Risk Strategies
- What Is Breakout Trading and How Does It Work?
- Mean Reversion: Technical Strategies and Risk Frameworks
- Momentum Trading: Indicators, Strategies, and Risk Control
- Hammer Candlestick: Structure, Meaning, and Strategy
- Doji Candlestick: Types, Signals, and Trading Strategies
- What Is the Sharpe Ratio and How to Calculate It
- What Is VWAP and How Do Traders Use It?
- Trade the Ascending Triangle: A Step-by-Step Practical Guide
- What Is the Stochastic Oscillator and How to Use It
- How to Trade the Descending Triangle Pattern
- High Frequency Trading: Speed, Algorithms, and Market Impact
- What Is Volume Profile and How to Use It in Trading
- What Is a Morning Star Pattern Candlestick?
- Trade with Parabolic SAR: A Practical Analysis Guide
- Evening Star Pattern: Structure, Rules, and Risk Controls
- Kelly Criterion: Formula, Position Sizing, and Risk
- What Is the NYSE Minimum Trading Price? Rules Explained
Disclaimer: The content on this page is intended for educational and informational purposes only. It does not constitute financial, investment, tax, or legal advice, and should not be interpreted as a recommendation to buy, sell, or hold any financial instrument or asset. Trading and investing involve significant risk, including the possible loss of your entire capital. Products such as forex, CFDs, and cryptocurrencies carry additional risks due to leverage, high volatility, and limited regulatory protection in some jurisdictions. Past performance of any financial instrument does not guarantee future results. Any market views, forecasts, or opinions expressed are those of the author at the time of writing and may not reflect current market conditions. Platform features, fees, and regulatory status are subject to change — always verify information directly with the relevant provider or regulator before making any financial decision. BrokerSpecs may receive compensation from third parties featured on this site. Always conduct your own due diligence and consider seeking advice from a licensed financial professional before investing. Portions of this article were prepared with the assistance of AI tools and reviewed by our editorial team before publication.