



Related Tags
You watch your screen as a beaten-down index suddenly prints a large green candle after weeks of aggressive selling. It looks like a bargain, tempting you to jump in before the market runs away without you. However, leaping into sudden surges without structural confirmation often disrupts a well-planned investment plan. At times, this sharp upward move is simply a dead cat bounce that may roll over into a deeper decline.
Dead Cat Bounce Meaning and Market Mechanics
A dead cat bounce is a temporary, unsustainable price recovery that occurs within a prolonged downtrend before the downward movement resumes. The phrase originates from an old Wall Street adage stating that even a dead cat will bounce if dropped from a sufficient height. In financial markets, this phenomenon represents a counter-trend relief rally that lures in optimistic buyers, only to trap them when sellers regain control. Regulatory bodies like the U.S. Securities and Exchange Commission (SEC) publish investor education on market volatility, and you may find it useful to ask whether a sudden price spike reflects genuine capital inflow or short-term trading imbalances.
To understand why this pattern unfolds, you need to examine who is actually buying during the rebound. When a steep sell-off pauses, the initial push upward is rarely driven by long-term institutional accumulation. Instead, the move is largely fueled by mechanical market dynamics and short-term speculative positioning.
The Mechanics of a Short Covering Rally
When a market trends downward aggressively, short sellers accumulate substantial paper profits. To lock in these gains, they must enter buy orders to close their positions, which triggers a rapid short covering rally. This sudden burst of buying absorbs existing sell orders and lifts prices without any long-term fundamental support. Once these short sellers finish taking profits and step aside, the artificial buying pressure evaporates, leaving the asset vulnerable to fresh selling.
How Long Does a Dead Cat Bounce Last?
A dead cat bounce can last anywhere from a few trading sessions to several weeks, depending on the asset class and timeframe. In a broader bear market bounce, these false rallies frequently exhibit fast, sharp price advances that deceive swing traders. Because underlying macroeconomic conditions remain unfavorable, the recovery eventually exhausts itself once sellers re-enter at more attractive prices.
How to Identify a Dead Cat Bounce Pattern on a Price Chart
Spotting a dead cat bounce pattern requires analyzing the progression of price action across three distinct phases. First, the asset undergoes an initial severe decline, breaking below key dynamic supports. Second, prices stage an abrupt upward reaction, retracing a portion of the preceding drop. Third, the rally stalls below overhead resistance, followed by a breakdown below the previous swing low.
Analyzing indicator behavior helps differentiate false recoveries from sustainable market turns. Genuine accumulation typically features rising buy volume and expanding market breadth. In contrast, a fake bounce exhibits volume exhaustion, where trading turnover shrinks as prices climb higher. Technical analysis principles published by the CFA Institute emphasize that analyzing volume divergences against price momentum provides essential context on whether a trend continuation or reversal is taking place.
Key Fibonacci retracement levels offer valuable reference points for identifying fake recoveries. A classic bear rally may stall between the 38.2% and 50.0% retracement levels of the primary sell-off. Furthermore, declining assets often fail to pierce dynamic moving averages, such as the 50-period or 200-period Exponential Moving Average (EMA). Traders who monitor broader chart patterns often spot classic topping formations, including a double top pattern, near these overhead resistance zones.
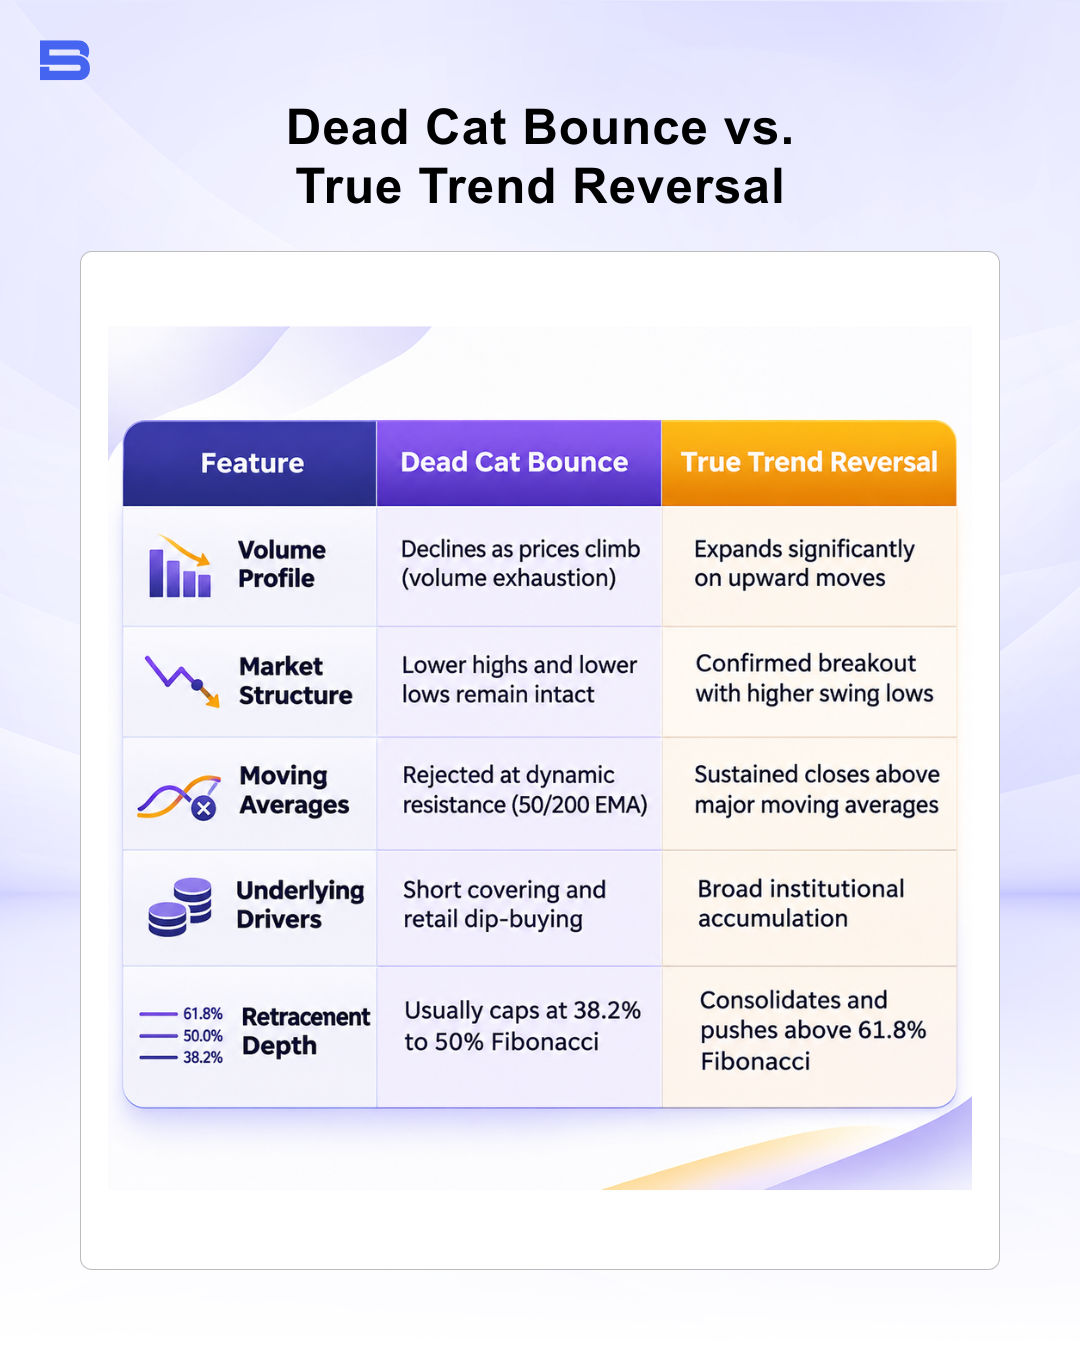
Dead Cat Bounce vs. True Trend Reversal: Structural Differences
Differentiating a dead cat bounce vs true reversal is crucial for protecting your trading capital. While both events begin with a cluster of strong green candles, their underlying structural footprints are fundamentally different.
A true market recovery builds a solid base, often printing higher lows and breaking through major market resistance on expanding institutional volume. A false recovery, on the other hand, lacks broad market participation and struggles to clear descending trendlines. Broader technical signals, such as an unresolved death cross (a short-term moving average falling below a long-term one) or an unconfirmed diamond pattern (a reversal formation where price swings widen and then narrow), frequently suggest that the primary bearish trend remains active.
| Feature | Dead Cat Bounce | True Reversal |
|---|---|---|
| Volume | Shrinking turnover as price climbs | Rising buy volume and expanding market breadth |
| Price structure | Struggles to clear descending trendlines, then breaks the previous swing low | Higher lows and a break through major resistance |
| Participation | Lacks broad market participation | Expanding institutional volume |
| Retracement | May stall between the 38.2% and 50.0% retracement levels | Builds a solid base above the prior sell-off lows |
The Anatomy of a Sucker Rally: How Bull Traps Form
A deceptive market bounce is often called a sucker rally because it preys on emotional decision-making. Following an aggressive market plunge, retail investors fear missing out on the exact market bottom. This emotional impulse encourages premature buying as soon as green candles appear on the chart.
Institutional participants and market makers recognize this influx of retail enthusiasm. They may use the temporary surge in liquidity to offload remaining inventory or establish fresh short positions at higher prices. As a result, the rally morphs into an aggressive bull trap, where late buyers find themselves trapped at the apex of the move. Once buy liquidity dries up, the market may resume its downward trajectory, which can trigger cascading stop-loss orders.
Strategic Risk Management: Navigating a Suspected Dead Cat Bounce
Navigating volatile market conditions requires strict discipline and systematic risk management. The Securities Commission Malaysia (SC) frequently cautions retail investors about the risks associated with high volatility and leveraged trading products. Attempting to catch a falling market or aggressively shorting a volatile rebound can lead to substantial financial losses without proper position sizing.
For long-term investors, patience may be a more cautious approach during a suspected false rally. Waiting for the market to establish a confirmed higher low may reduce the chance of being caught in a continuation breakdown. For active CFD traders seeking to trade the downtrend continuation, defining entry criteria and strict stop-loss levels is essential.
Consider a practical scenario trading a major index CFD. Suppose an index drops from 5,200 points to 4,500 points before staging a sharp relief rally. The 38.2% Fibonacci retracement level aligns with horizontal resistance near 4,767 points, rounding to 4,800 points.
You plan a short trade entering at 4,800 points once bearish rejection candles appear. You place a protective stop-loss above the local swing high at 4,920 points, representing a risk of 120 points. Your profit target is set near the previous low at 4,500 points, offering a potential gain of 300 points.
With an account balance of $10,000, you limit your risk to 1.2% ($120). Trading 1 CFD contract ($1 per point) keeps your planned risk at $120 before costs and gives a risk-to-reward ratio of 1:2.5. However, slippage, price gaps, spreads, and overnight financing charges can make the actual loss larger than planned.
Leverage amplifies your returns when the trade moves favorably, but it accelerates capital losses just as quickly when the market surges against you. A sudden 5% short squeeze (a rapid price spike as short sellers rush to buy back their positions) against an overleveraged position can wipe out your margin balance within minutes.
Waiting for Structural Confirmation Over Emotional Anticipation
Surviving prolonged market downturns requires objective technical confirmation rather than emotional anticipation. Prioritizing capital preservation and waiting for structural market clarity may serve your portfolio better than trying to catch every rebound.
- How to Build an Investment Plan That Actually Works for You?
- What Is the MACD Indicator and How to Use It
- What Is a Wedge Pattern in Trading?
- What Is Ichimoku Cloud Strategy? A Complete Trading System
- Mastering Elliott Wave Theory: Rules and Trading Strategies
- News Trading: Strategies, Execution Risks, and Risk Control
- What Is an Iron Condor Options Strategy?
- Backtesting Explained: What It Is and Why It Really Matters
- Grid Trading: Mechanics, Parameters, and Risk Strategies
- What Is Breakout Trading and How Does It Work?
- Mean Reversion: Technical Strategies and Risk Frameworks
- Momentum Trading: Indicators, Strategies, and Risk Control
- Hammer Candlestick: Structure, Meaning, and Strategy
- Doji Candlestick: Types, Signals, and Trading Strategies
- What Is the Sharpe Ratio and How to Calculate It
- What Is VWAP and How Do Traders Use It?
- Trade the Ascending Triangle: A Step-by-Step Practical Guide
- What Is the Stochastic Oscillator and How to Use It
- How to Trade the Descending Triangle Pattern
- High Frequency Trading: Speed, Algorithms, and Market Impact
- What Is Volume Profile and How to Use It in Trading
- What Is a Morning Star Pattern Candlestick?
- Trade with Parabolic SAR: A Practical Analysis Guide
- Evening Star Pattern: Structure, Rules, and Risk Controls
- Kelly Criterion: Formula, Position Sizing, and Risk
- What Is the NYSE Minimum Trading Price? Rules Explained
Disclaimer: The content on this page is intended for educational and informational purposes only. It does not constitute financial, investment, tax, or legal advice, and should not be interpreted as a recommendation to buy, sell, or hold any financial instrument or asset. Trading and investing involve significant risk, including the possible loss of your entire capital. Products such as forex, CFDs, and cryptocurrencies carry additional risks due to leverage, high volatility, and limited regulatory protection in some jurisdictions. Past performance of any financial instrument does not guarantee future results. Any market views, forecasts, or opinions expressed are those of the author at the time of writing and may not reflect current market conditions. Platform features, fees, and regulatory status are subject to change — always verify information directly with the relevant provider or regulator before making any financial decision. BrokerSpecs may receive compensation from third parties featured on this site. Always conduct your own due diligence and consider seeking advice from a licensed financial professional before investing. Portions of this article were prepared with the assistance of AI tools and reviewed by our editorial team before publication.