



Related Tags
You are watching the 15-minute chart as price aggressively pierces a prior swing high, tempting you to click buy immediately. Minutes later, the candle retreats, leaving an upper wick and reversing straight into your stop-loss. Learning how to read a true break of structure helps you distinguish institutional momentum from deceptive liquidity traps.
What Is a Break of Structure in Trading?
A break of structure in trading occurs when price decisively closes beyond an established swing high or swing low, signaling trend continuation. This price action milestone suggests that market participants have committed enough capital to overcome existing supply or demand barriers.
In institutional auction theory, price moves in continuous cycles of liquidity seeking and directional expansion. When buyers absorb all available resting sell orders at a resistance level, the resulting structural breach reflects an imbalance where aggressive demand outweighs passive supply.
Understanding this shift is fundamental to market structure in trading. Rather than treating chart patterns as abstract shapes, market structure analysis views each structural break as measurable evidence of order flow conviction.
How to Identify a Bullish and Bearish Break of Structure (BOS)
A bullish break of structure takes place in an uptrend when price forms a new higher high by breaking cleanly above the previous swing high. Conversely, a bearish BOS occurs in a downtrend when price drives through an established swing low to record a lower low.
To confirm a valid BOS (break of structure), you should look for clear displacement rather than hesitant, low-momentum movement. True structural breaks typically feature wide-range candles that expand rapidly through key pivot levels.
In the smart money concept framework, strong momentum and rising volume are read as signs that professional participants are actively defending their direction.
How to Identify a Break of Structure on Your Chart
Accurately mapping market structure requires an objective method to identify major swing points before evaluating breaks. You can begin by scanning your chart for distinct structural pivots where price made an unmistakable directional turn.
A swing high is formed when a candle high is flanked by lower highs on both sides, creating a clear peak. A swing low requires a central low flanked by higher lows, establishing a defined valley.
Once these boundaries are mapped, you mark the horizontal price level across the extreme pivot. A structural break only occurs when incoming price action interacts with and breaches that exact horizontal boundary.
Candle Body Close vs. Wick Break: Validating Market Structure
The debate between candle body closes and wick breaks is one of the most critical nuances in technical analysis. While some aggressive traders treat a wick piercing a level as a break, conservative traders wait for a full candle body to close beyond the pivot.
A wick that extends past a swing high but fails to close above it frequently represents a liquidity grab. In these cases, larger participants may be targeting retail breakout orders and resting stop-losses to build positions in the opposite direction.
Requiring a full candle body close can help you avoid some liquidity traps, although no confirmation method removes false breaks entirely. Checking each structural level against a higher-timeframe chart before you act is a practical way to keep your risk rules objective.
Internal BOS vs. Swing BOS: Which One Matters More?
Price action is inherently fractal, which means structural breaks occur across every timeframe simultaneously. A swing BOS refers to the break of a major external pivot visible on higher timeframes like the daily or 4-hour chart.
An internal BOS, by contrast, happens within the minor sub-structure of lower timeframes such as the 5-minute or 15-minute chart. Internal breaks often signal the beginning of a pullback toward a higher-timeframe support or resistance zone.
Trading an internal BOS as if it were a major trend continuation often leads to premature entries. Aligning your trades with higher-timeframe swing structure ensures that minor pullbacks do not trap your capital.
BOS vs. CHoCH: What Is the Difference?
Is BOS a trend continuation signal? Generally yes, because a BOS suggests the prevailing trend is still intact, but it is a prompt to look for confirmation, not a guarantee.
Traders frequently confuse a BOS with a Change of Character (CHoCH), but their strategic implications are fundamentally different. A BOS represents trend continuation, confirming that the prevailing directional trend remains intact.
A CHoCH represents an early warning of a potential trend reversal. While a bullish BOS breaks an existing higher high in an uptrend, a bearish CHoCH occurs when an uptrend breaks its first higher low, signaling that buyers have lost control.
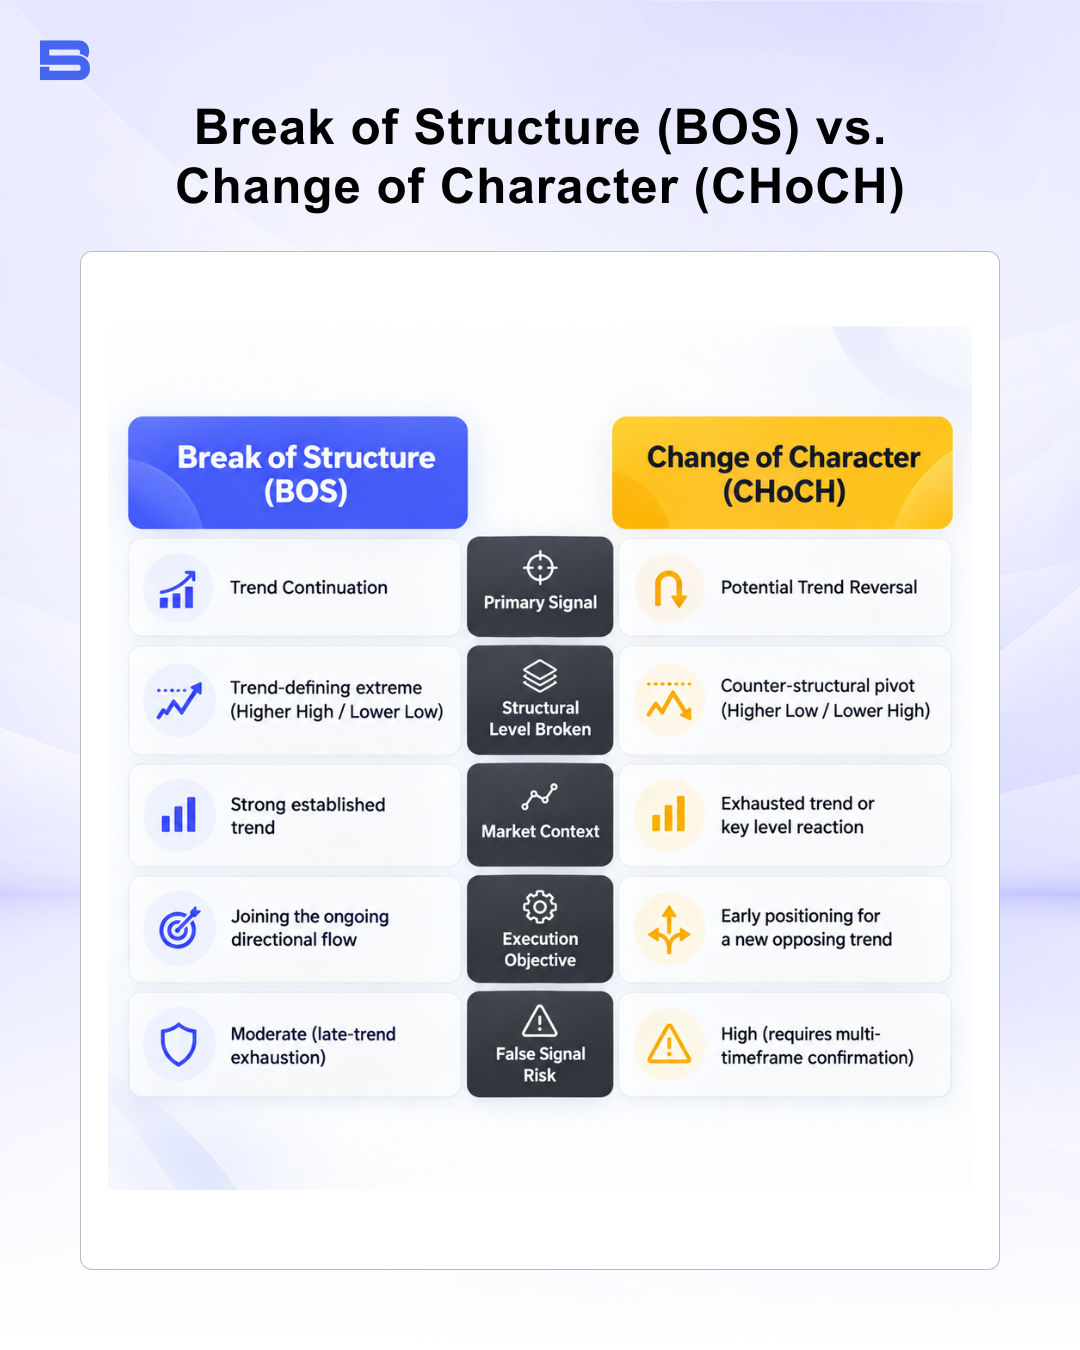
Recognizing whether you are observing continuation or reversal helps prevent fighting established trends. While a CHoCH alerts you to potential macro shifts, a BOS suggests that institutional flow has resumed.
How to Trade BOS: Execution Strategy and Risk Management
So, what happens after a break of structure? Price often pauses or pulls back before its next move, which is why many traders wait for a retracement instead of entering at the break itself.
A common retail mistake is buying the instant a structural break occurs, which frequently results in buying at the absolute high of an expansion leg. Professional execution models wait for price to retrace into a high-probability zone after structure breaks.
Following a bullish break, price often retraces into a discount zone below the 50% equilibrium level, which is the midpoint of the impulse move. Inside this discount area, traders watch for institutional footprints like an order block (the last opposing candle before the impulse move) or a fair value gap (a three-candle price gap that shows an imbalance between buyers and sellers).
Traders using optimal trade entry (OTE) strategies calculate Fibonacci retracements between 61.8% and 79% of the impulse move for tighter entry precision. Entering on retracements allows you to place logical stop-losses behind structural protection points rather than floating in open air.
Consider a hypothetical example on the EUR/USD 1-hour chart. The prices below are for illustration only and are not a trade recommendation. Price breaks an established swing high at 1.0850 with a solid candle body close, establishing a valid bullish break of structure.
Rather than entering at 1.0850, you wait for a retracement into a fair value gap resting at 1.0820. You enter long at 1.0820, position your protective stop-loss at 1.0795 below the retracement low, and set a take-profit target at 1.0895 near the next major pool of liquidity.
This trade risks 25 pips to capture 75 pips of potential profit, yielding a 1:3 risk-to-reward ratio. On a standard 1-lot position, where each pip is worth about $10, you would be risking roughly $250 to pursue a potential gross profit of roughly $750, before spreads and fees.
Trading leveraged CFDs amplifies returns when price moves in your favor, but it accelerates capital losses just as quickly if the market invalidates your setup. The Financial Conduct Authority (FCA) restricts retail CFD trading through leverage caps, mandatory margin close-out, negative balance protection, and a standardized risk warning, because leveraged losses can build quickly. Many traders also use predefined stop-losses and careful position sizing to keep any single loss small.
How to Avoid a False Break of Structure
False breaks occur frequently during periods of low market participation or preceding major macroeconomic data releases. You can protect your trading balance by evaluating market context before placing execution orders.
First, ensure the breakout candle displays genuine displacement with a visible rise in tick volume, rather than small indecisive candles. Spot forex has no centralized volume feed, so tick volume is the usual proxy. Second, avoid trading structural breaks that form during illiquid session crossovers or minutes before scheduled central bank announcements.
Finally, never trade lower-timeframe breaks that push directly into higher-timeframe supply or demand zones. Counter-trend breaks on minor timeframes often fail, because price is pushing directly into a higher-timeframe supply or demand zone.
Trading Structure With Confirmation and Patience
Mastering the break of structure enables you to align your trades with institutional momentum rather than falling victim to emotional breakout traps. By pairing candle body validation with patient retracement entries and rigorous risk management, you can build a more structured, rules-based approach to reading price action, though no method guarantees results.
- How to Build an Investment Plan That Actually Works for You?
- What Is the MACD Indicator and How to Use It
- What Is a Wedge Pattern in Trading?
- What Is Ichimoku Cloud Strategy? A Complete Trading System
- Mastering Elliott Wave Theory: Rules and Trading Strategies
- News Trading: Strategies, Execution Risks, and Risk Control
- What Is an Iron Condor Options Strategy?
- Backtesting Explained: What It Is and Why It Really Matters
- Grid Trading: Mechanics, Parameters, and Risk Strategies
- What Is Breakout Trading and How Does It Work?
- Mean Reversion: Technical Strategies and Risk Frameworks
- Momentum Trading: Indicators, Strategies, and Risk Control
- Hammer Candlestick: Structure, Meaning, and Strategy
- Doji Candlestick: Types, Signals, and Trading Strategies
- What Is the Sharpe Ratio and How to Calculate It
- What Is VWAP and How Do Traders Use It?
- Trade the Ascending Triangle: A Step-by-Step Practical Guide
- What Is the Stochastic Oscillator and How to Use It
- How to Trade the Descending Triangle Pattern
- High Frequency Trading: Speed, Algorithms, and Market Impact
- What Is Volume Profile and How to Use It in Trading
- What Is a Morning Star Pattern Candlestick?
- Trade with Parabolic SAR: A Practical Analysis Guide
- Evening Star Pattern: Structure, Rules, and Risk Controls
- Kelly Criterion: Formula, Position Sizing, and Risk
- What Is the NYSE Minimum Trading Price? Rules Explained
Disclaimer: The content on this page is intended for educational and informational purposes only. It does not constitute financial, investment, tax, or legal advice, and should not be interpreted as a recommendation to buy, sell, or hold any financial instrument or asset. Trading and investing involve significant risk, including the possible loss of your entire capital. Products such as forex, CFDs, and cryptocurrencies carry additional risks due to leverage, high volatility, and limited regulatory protection in some jurisdictions. Past performance of any financial instrument does not guarantee future results. Any market views, forecasts, or opinions expressed are those of the author at the time of writing and may not reflect current market conditions. Platform features, fees, and regulatory status are subject to change — always verify information directly with the relevant provider or regulator before making any financial decision. BrokerSpecs may receive compensation from third parties featured on this site. Always conduct your own due diligence and consider seeking advice from a licensed financial professional before investing. Portions of this article were prepared with the assistance of AI tools and reviewed by our editorial team before publication.