


- How to Build an Investment Plan That Actually Works for You?
- What Is the MACD Indicator and How to Use It
- What Is a Wedge Pattern in Trading?
- What Is Ichimoku Cloud Strategy? A Complete Trading System
- Mastering Elliott Wave Theory: Rules and Trading Strategies
- News Trading: Strategies, Execution Risks, and Risk Control
- What Is an Iron Condor Options Strategy?
- Backtesting Explained: What It Is and Why It Really Matters
- Grid Trading: Mechanics, Parameters, and Risk Strategies
- What Is Breakout Trading and How Does It Work?
- Mean Reversion: Technical Strategies and Risk Frameworks
- Momentum Trading: Indicators, Strategies, and Risk Control
- Hammer Candlestick: Structure, Meaning, and Strategy
- Doji Candlestick: Types, Signals, and Trading Strategies
- What Is the Sharpe Ratio and How to Calculate It
- What Is VWAP and How Do Traders Use It?
- Trade the Ascending Triangle: A Step-by-Step Practical Guide
- What Is the Stochastic Oscillator and How to Use It
- How to Trade the Descending Triangle Pattern
- High Frequency Trading: Speed, Algorithms, and Market Impact
- What Is Volume Profile and How to Use It in Trading
- What Is a Morning Star Pattern Candlestick?
- Trade with Parabolic SAR: A Practical Analysis Guide
- Evening Star Pattern: Structure, Rules, and Risk Controls
You sit before your trading screen watching price candles compress into an unusually narrow range. You know that quiet consolidation often precedes an explosive price move, but guessing which direction the breakout will unfold feels more like flipping a coin than executing a disciplined trade setup. High market volatility can easily trigger false signals, leading to premature entries and costly account drawdowns.
Volatility channel overlays help eliminate this guesswork by projecting dynamic price boundaries directly onto your charting platform. Among these technical tools, the Keltner Channel stands out as a reliable volatility-based envelope designed to help traders identify prevailing market trends, spot breakout opportunities, and set objective risk parameters in various market conditions.
Understanding how this indicator measures price action allows you to incorporate structured technical analysis into your daily trading workflow.
What Is the Keltner Channel Indicator?
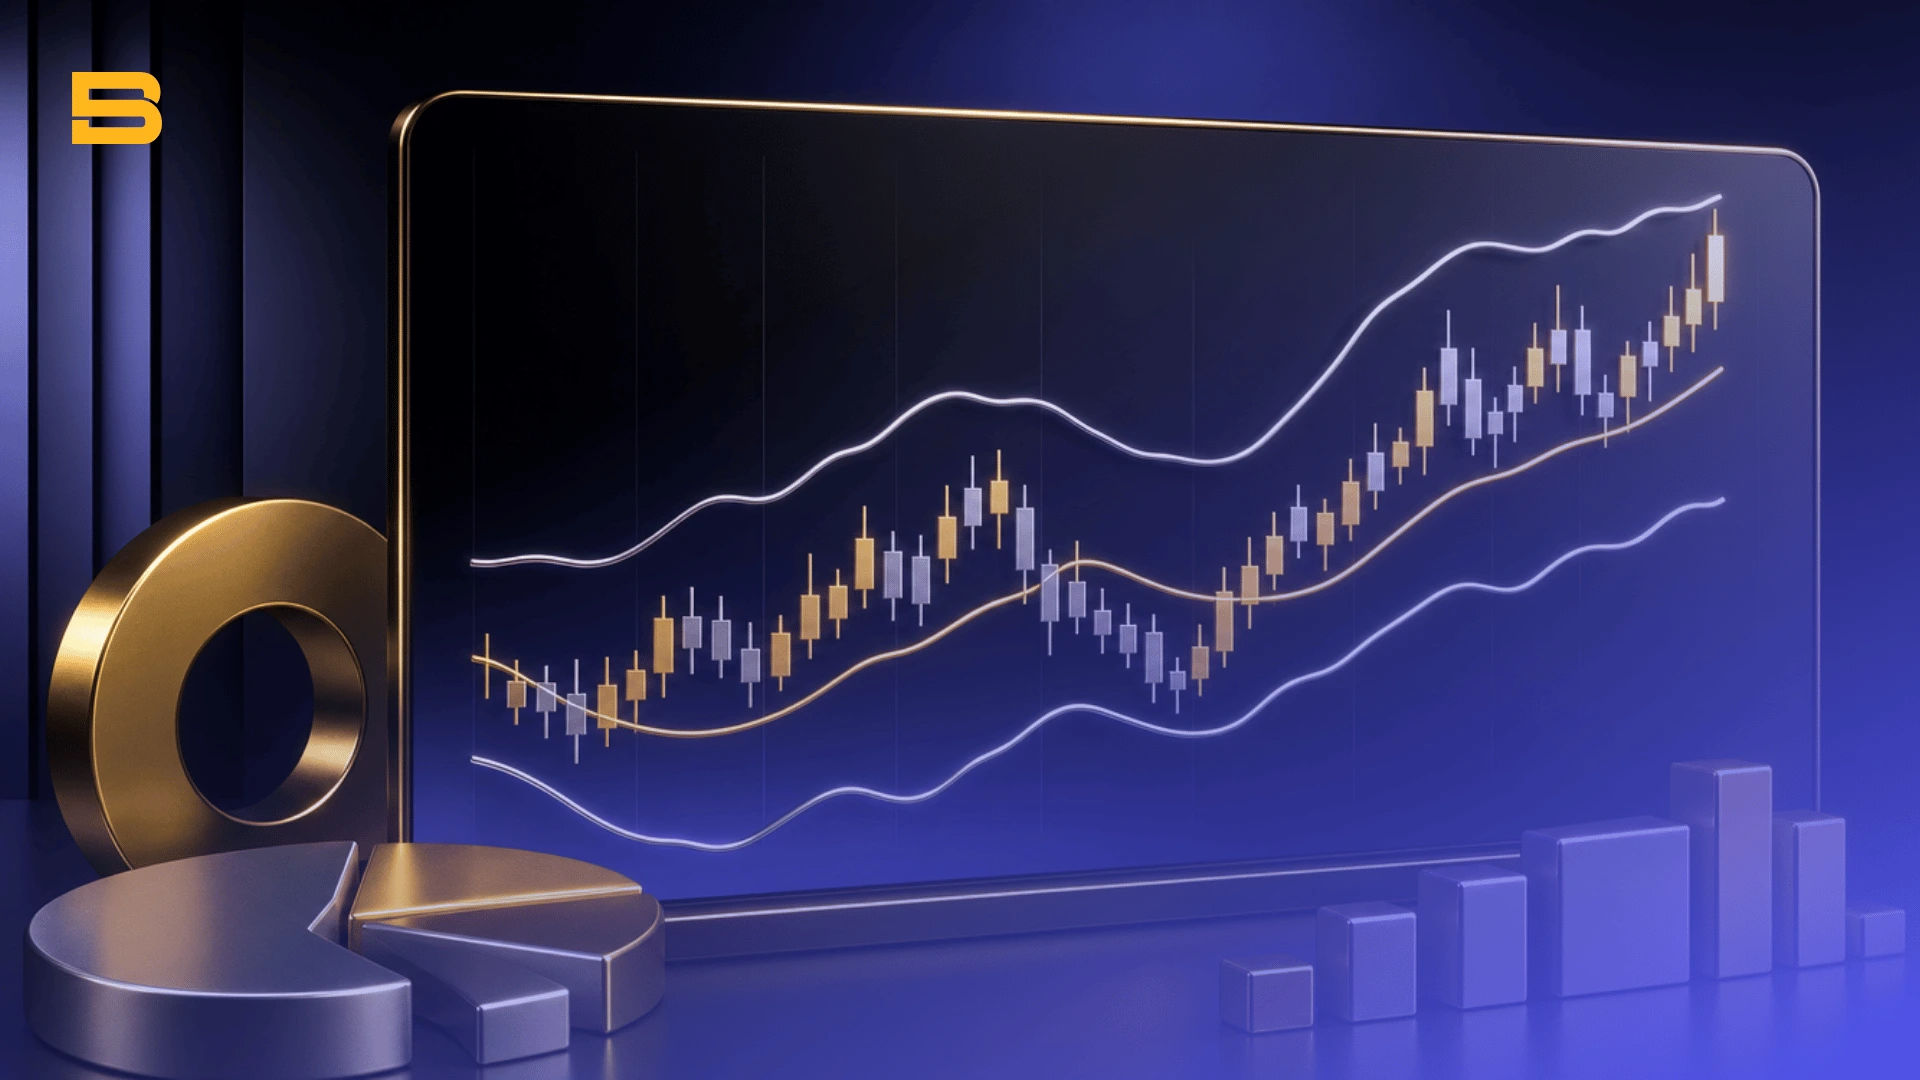
The Keltner Channel is a volatility-based technical analysis indicator consisting of a central moving average envelope bounded by upper and lower Average True Range bands. Developed by grain trader Chester Keltner in 1960 and later refined by Linda Raschke in the 1980s, this chart overlay measures market volatility to define dynamic support and resistance levels.
Unlike simple channel envelopes that rely on fixed percentages, Keltner Channels automatically adjust their band width based on actual market fluctuations. When market volatility increases, the outer bands expand to accommodate wider price swings. Conversely, during low-volatility consolidation periods, the channel contracts around price action.
The Center Line: Exponential Moving Average (EMA)
The foundation of the indicator is its center baseline, which typically defaults to a 20-period exponential moving average. This center line acts as the core trend direction indicator for the underlying asset. When price trades above the middle exponential moving average, the overall short-to-medium trend is considered bullish, whereas price action beneath the baseline suggests bearish momentum.
Because an EMA places greater weight on recent price data compared to a simple moving average, the center line reacts quickly to market turns. Traders frequently use this baseline as a dynamic trailing stop or as a primary pullback level during sustained trend moves.
The Outer Bands: Average True Range (ATR Multiplier)
The upper and lower channel boundaries are calculated by taking the center line and adding or subtracting a multiple of the Average True Range. The standard setting uses a 10-period or 14-period Average True Range multiplied by 2. According to academic research published by the CFA Institute, the ATR provides a comprehensive measurement of asset volatility by accounting for gaps between trading sessions.
The formula for the indicator overlay is calculated using three component steps:
-
Center Line = 20-period Exponential Moving Average (EMA)
-
Upper Band = 20-period EMA + (2 × 14-period ATR)
-
Lower Band = 20-period EMA − (2 × 14-period ATR)
Because ATR smooths volatility measurements across high, low, and closing prices, the resulting bands expand and contract gracefully without distorting chart readability.
How Do You Trade with Keltner Channel?
Trading effectively with Keltner Channels requires matching your tactical entry framework to the broader market environment. Traders primarily deploy Keltner Channels in two market conditions: breakout momentum trades during volatility expansions and pullback entries during strong directional trends.
Choosing the Right Keltner Channel Settings
Selecting the optimal settings depends heavily on your preferred trading timeframe and risk tolerance. While the default configuration of a 20-period EMA and a 2.0 ATR multiplier works well for daily and 4-hour swing trading setups, intraday traders often adjust these inputs for quicker responsiveness.
Short-term day traders and scalpers may prefer a faster baseline, such as a 10-period EMA paired with a 1.5 ATR multiplier. This tighter setting brings the channel bands closer to price action, generating earlier signals during rapid intraday moves. Conversely, position traders analyzing weekly charts frequently widen the channel using a 2.5 or 3.0 ATR multiplier to filter out routine market noise.
Trading Channel Breakouts
A popular strategy among momentum traders is the Keltner Channel breakout strategy. Under normal trading conditions, price action typically remains contained inside the upper and lower bands, with closes outside the channel being comparatively rare. When a candlestick manages to close completely outside the upper or lower ATR band, it signifies unusual momentum rather than an overbought or oversold condition.
A valid candle close above the upper channel signals strong buying pressure, providing an entry signal for a long position. Conversely, a candle close below the lower channel indicates aggressive selling power, signaling a potential short entry. To avoid entering on false breakouts, traders often wait for a secondary confirmation candle or elevated trading volume.
Trend Pullback Entries
In established trending markets, Keltner Channels offer excellent high-probability pullback opportunities. Rather than buying at market highs, trend followers wait for price to temporarily retrace back toward the central EMA baseline.
When the market is in a clear uptrend, a temporary decline to the middle EMA provides a favorable risk-reward entry to re-establish long positions. Similarly, in a strong downtrend, temporary rallies toward the central line offer short entry opportunities.
Consider a practical trading scenario using EUR/USD on a 1-hour chart:
-
Market Setup: EUR/USD is in an established uptrend, trading at 1.0850.
-
Pullback Entry: Price retraces to touch the central 20 EMA baseline at 1.0820.
-
Stop Loss Order: Placed just below the lower channel band at 1.0780 (risk = 40 pips).
-
Profit Target: Set near the upper channel band expansion at 1.0900 (reward = 80 pips).
-
Risk-Reward Ratio: 1:2, offering a structured statistical edge.
Managing leverage and position sizing is vital during volatility trading, as sudden market reversals can quickly lead to substantial capital losses. The US Commodity Futures Trading Commission (CFTC) emphasizes that leveraged trading amplifies both profit potential and loss exposure, making strict stop-loss discipline essential on every execution.
Comparing Keltner Channel vs. Bollinger Bands vs. Donchian Channel
To select the right volatility envelope for your trading style, it is helpful to compare the Keltner Channel, Bollinger Bands, and Donchian Channel technical overlays side by side. While all three indicators plot dynamic upper and lower bands around price action, their core underlying calculations produce distinctly different trading signals.
The main structural difference lies between ATR-based Keltner Channels and standard-deviation-based Bollinger Bands. Bollinger Bands expand rapidly during sudden market shocks because standard deviation measures variance from the mean squared. This sensitivity often causes Bollinger Bands to balloon excessively, making it difficult to set logical stop-loss levels.
In contrast, Keltner Channels measure volatility using smooth ATR calculations, resulting in cleaner and more consistent channel boundaries. Meanwhile, the Donchian Channel tracks absolute price extremes over a set lookback period, creating step-like lines that lack moving average smoothing. Consequently, Keltner Channels are generally less prone to generating false expansion whipsaws during choppy, range-bound market conditions.
Combining Keltner Channels with Momentum Indicators
Relying solely on a single chart overlay can leave traders vulnerable to whipsaws when markets transition between range-bound consolidation and trend expansion. Combining Keltner Channels with secondary momentum oscillators creates a robust trading system that filters out weak or false entry signals.
Filtering Breakouts with RSI and MACD Indicators
Confirming channel breakouts with momentum indicators ensures that price movement is supported by actual underlying volume and velocity. Integrating the RSI indicator helps traders identify whether a channel breakout possesses sufficient strength to continue.
For example, when price breaks above the upper Keltner Channel, an RSI reading above 60 confirms bullish momentum without necessarily being prematurely overbought. Concurrently, checking the MACD indicator for a zero-line cross or histogram expansion validates that directional momentum is strengthening. If price breaks the outer channel band while the MACD histogram shows declining momentum, the breakout is more likely to fail.
Identifying Channel Support and Resistance
During sideways or range-bound market conditions, the upper and lower outer bands function as dynamic support and resistance zones. When price approaches the outer ATR bands in a non-trending environment, traders can look for candlestick reversal signals to trade mean-reversion setups back toward the central EMA line.
Identifying when the outer bands act as dynamic support and resistance allows range traders to capture consistent short-term swings while maintaining tightly defined risk parameters just beyond the channel boundaries.
Combining Different Indicators
The Keltner Channel is a versatile technical analysis overlay that brings structure to volatile financial markets. By combining an exponential moving average trend baseline with Average True Range volatility bands, it offers traders an objective framework for identifying strong breakouts, entering trend pullbacks, and managing trading risk.
Whether applied independently or paired with momentum oscillators like the RSI and MACD, incorporating Keltner Channels into your trading plan helps replace emotional guesswork with disciplined execution. Always backtest your settings on historical data and practice risk management before risking real capital in live markets.
Disclaimer: The content on this page is intended for educational and informational purposes only. It does not constitute financial, investment, tax, or legal advice, and should not be interpreted as a recommendation to buy, sell, or hold any financial instrument or asset. Trading and investing involve significant risk, including the possible loss of your entire capital. Products such as forex, CFDs, and cryptocurrencies carry additional risks due to leverage, high volatility, and limited regulatory protection in some jurisdictions. Past performance of any financial instrument does not guarantee future results. Any market views, forecasts, or opinions expressed are those of the author at the time of writing and may not reflect current market conditions. Platform features, fees, and regulatory status are subject to change — always verify information directly with the relevant provider or regulator before making any financial decision. BrokerSpecs may receive compensation from third parties featured on this site. Always conduct your own due diligence and consider seeking advice from a licensed financial professional before investing.