


- How to Build an Investment Plan That Actually Works for You?
- What Is the MACD Indicator and How to Use It
- What Is a Wedge Pattern in Trading?
- What Is Ichimoku Cloud Strategy? A Complete Trading System
- Mastering Elliott Wave Theory: Rules and Trading Strategies
- News Trading: Strategies, Execution Risks, and Risk Control
- What Is an Iron Condor Options Strategy?
- Backtesting Explained: What It Is and Why It Really Matters
- Grid Trading: Mechanics, Parameters, and Risk Strategies
- What Is Breakout Trading and How Does It Work?
- Mean Reversion: Technical Strategies and Risk Frameworks
- Momentum Trading: Indicators, Strategies, and Risk Control
- Hammer Candlestick: Structure, Meaning, and Strategy
- Doji Candlestick: Types, Signals, and Trading Strategies
- What Is the Sharpe Ratio and How to Calculate It
- What Is VWAP and How Do Traders Use It?
- Trade the Ascending Triangle: A Step-by-Step Practical Guide
- What Is the Stochastic Oscillator and How to Use It
- How to Trade the Descending Triangle Pattern
- High Frequency Trading: Speed, Algorithms, and Market Impact
- What Is Volume Profile and How to Use It in Trading
- What Is a Morning Star Pattern Candlestick?
- Trade with Parabolic SAR: A Practical Analysis Guide
- Evening Star Pattern: Structure, Rules, and Risk Controls

You watch an underlying stock trade within a tight $5 range for three consecutive weeks leading into an earnings report or economic release. While most market participants scramble to guess whether the stock will surge or plummet, you realize that implied volatility is bloated and a big directional move is unlikely. In scenarios where you expect price consolidation rather than a breakout, directionally aggressive trades carry unnecessary risk.
What Is a Butterfly Spread?
A butterfly spread is a neutral, defined-risk options strategy that combines bull and bear spreads to profit from low asset price volatility. By purchasing outer options contracts and selling middle options contracts, you establish a capped profit zone centered around a specific target price.
Unlike directional strategies that require substantial price movement to yield returns, a butterfly spread relies on price stability and accelerating time decay. The trade reaches its optimal value when the underlying asset settles directly at the center strike price upon contract expiration.
Because you enter the position as a net debit, your maximum financial exposure is strictly limited to the initial cost required to open the structure.
Anatomy of a Butterfly Spread: The 1x2x1 Setup
To structure a classic butterfly spread, you execute four options contracts across three distinct strike prices using a strict 1x2x1 ratio. All contracts must share the identical expiration date and underlying asset.
The setup consists of three core components:
- Lower Wing: You purchase 1 in-the-money (ITM) option at a lower strike price. This leg establishes the lower bound of your profit zone, similar to the long leg of a bull call spread.
- Body Strikes: You sell 2 at-the-money (ATM) options at the middle strike price. These wings and body strikes create the peak profit point where time decay works most aggressively in your favor.
- Upper Wing: You purchase 1 out-of-the-money (OTM) option at a higher strike price. This contract acts as an explicit hedge, establishing a defined risk ceiling similar to the long leg of a bear put spread.
The distance between the lower strike and the middle strike must exactly equal the distance between the middle strike and the upper strike. Official contract specifications from the Cboe require symmetrical strike spacing to ensure the payoff profile remains balanced on both sides of the market.
Worked Example: Long Call Butterfly Math Step-by-Step
To understand how the entry pricing functions, suppose underlying stock XYZ trades at $100 per share. You expect XYZ to remain near $100 over the next 30 days and decide to open a long call butterfly spread.
You execute the following orders simultaneously:
- Leg 1: Buy 1 XYZ $95 call at $6.00 debit ($600 total outlay).
- Leg 2: Sell 2 XYZ $100 calls at $3.00 credit each ($600 total credit received).
- Leg 3: Buy 1 XYZ $105 call at $1.50 debit ($150 total outlay).
To calculate your total net debit, sum the outlay of the outer long wings and subtract the total credit received from the sold body strikes:
Net Debit = $6.00 + $1.50 − (2 × $3.00) = $1.50
Because each contract represents 100 shares, your total capital required to open this trade is exactly $150 ($1.50 × 100). This initial cost represents your entire downside exposure if the stock moves completely outside your strike boundaries.
Butterfly Spread Payoff: Max Profit, Max Loss, and Breakeven Points
Understanding the payoff parameters allows you to evaluate your risk-to-reward metrics before placing an order. The strategy features capped losses on both sides of the market, paired with a distinct profit peak. Regulators such as FINRA emphasize reviewing spread breakevens to confirm the probability of trade success.
The fundamental mathematics governing the payoff structure include:
- Maximum Loss: Capped at the initial net debit paid ($1.50 per share, or $150 total). You incur this loss if XYZ finishes below $95 or above $105 at expiration.
- Maximum Profit: Calculated as the difference between the middle strike and the lower strike, minus the net debit paid:
- Max Profit = ($100 − $95) − $1.50 = $3.50
At 100 shares per contract, your maximum return is $350. Achieving maximum profit requires XYZ to close at $100 on expiration day. - Lower Breakeven Point: Calculated by adding the net debit to the lower strike price:
Lower Breakeven = $95 + $1.50 = $96.50 - Upper Breakeven Point: Calculated by subtracting the net debit from the upper strike price:
Upper Breakeven = $105 − $1.50 = $103.50
If XYZ finishes between $96.50 and $103.50 at expiration, the trade closes with a net profit.
Common Variations: Long Call, Long Put, Iron Butterfly, and Broken Wing
While the standard long call butterfly spread is widely used, traders adjust the contract composition to match structural or pricing requirements.
Long Call Butterfly Strategy Setup
The standard long call butterfly uses four call contracts to build a neutral debit position. It requires minimal capital and provides an ideal risk profile when you expect low underlying volatility.
Long Put Butterfly Strategy Setup
A long put butterfly replicates the payoff of the long call setup using put option contracts instead. You purchase 1 ITM put, sell 2 ATM puts, and purchase 1 OTM put. Synthetic parity ensures that debit call and debit put butterflies deliver identical theoretical payoff curves when strikes are equivalent.
Iron Butterfly Variant
An iron butterfly combines a bear call spread and a bull put spread to create a net credit trade. You sell 1 ATM call and 1 ATM put at the middle strike, while purchasing 1 OTM call and 1 OTM put as outer wings. This structure increases assignment sensitivity near the middle strike but provides equivalent risk-reward parameters.
Broken Wing Butterfly Variant
A broken wing butterfly uses asymmetrical strike intervals, such as placing the upper wing further away from the center strike. This modification eliminates downside risk entirely in exchange for shifting the breakeven points or introducing higher exposure on the wider side.
Managing Risk, Time Decay, and the Expiration Gamma Trap
A butterfly spread exhibits negative vega and positive theta as expiration approaches. Shrinking implied volatility increases the value of the position, while accelerating time decay reduces the premium of the two short body options faster than the long wings.
However, holding a butterfly spread into the final week before expiration exposes you to severe pin risk and a potential gamma trap. As the expiration date nears, short options at the money experience exponential gamma acceleration.
Regulatory guidelines from the U.S. Securities and Exchange Commission (SEC) highlight the elevated risks of physical delivery assignment when holding short options near expiration.
If the underlying stock hovers directly around your middle strike during final trading hours, minor price fluctuations can cause your short contracts to flip rapidly between ITM and OTM states. To eliminate assignment risk and manual exercise complications, experienced traders consistently close butterfly spreads when capturing 50% to 75% of maximum profit rather than holding contracts to final expiration.
Comparing Butterfly Spreads to Iron Condors and Other Neutral Strategies
When choosing between neutral options strategies, you must balance profit zone width against entry cost and return potential.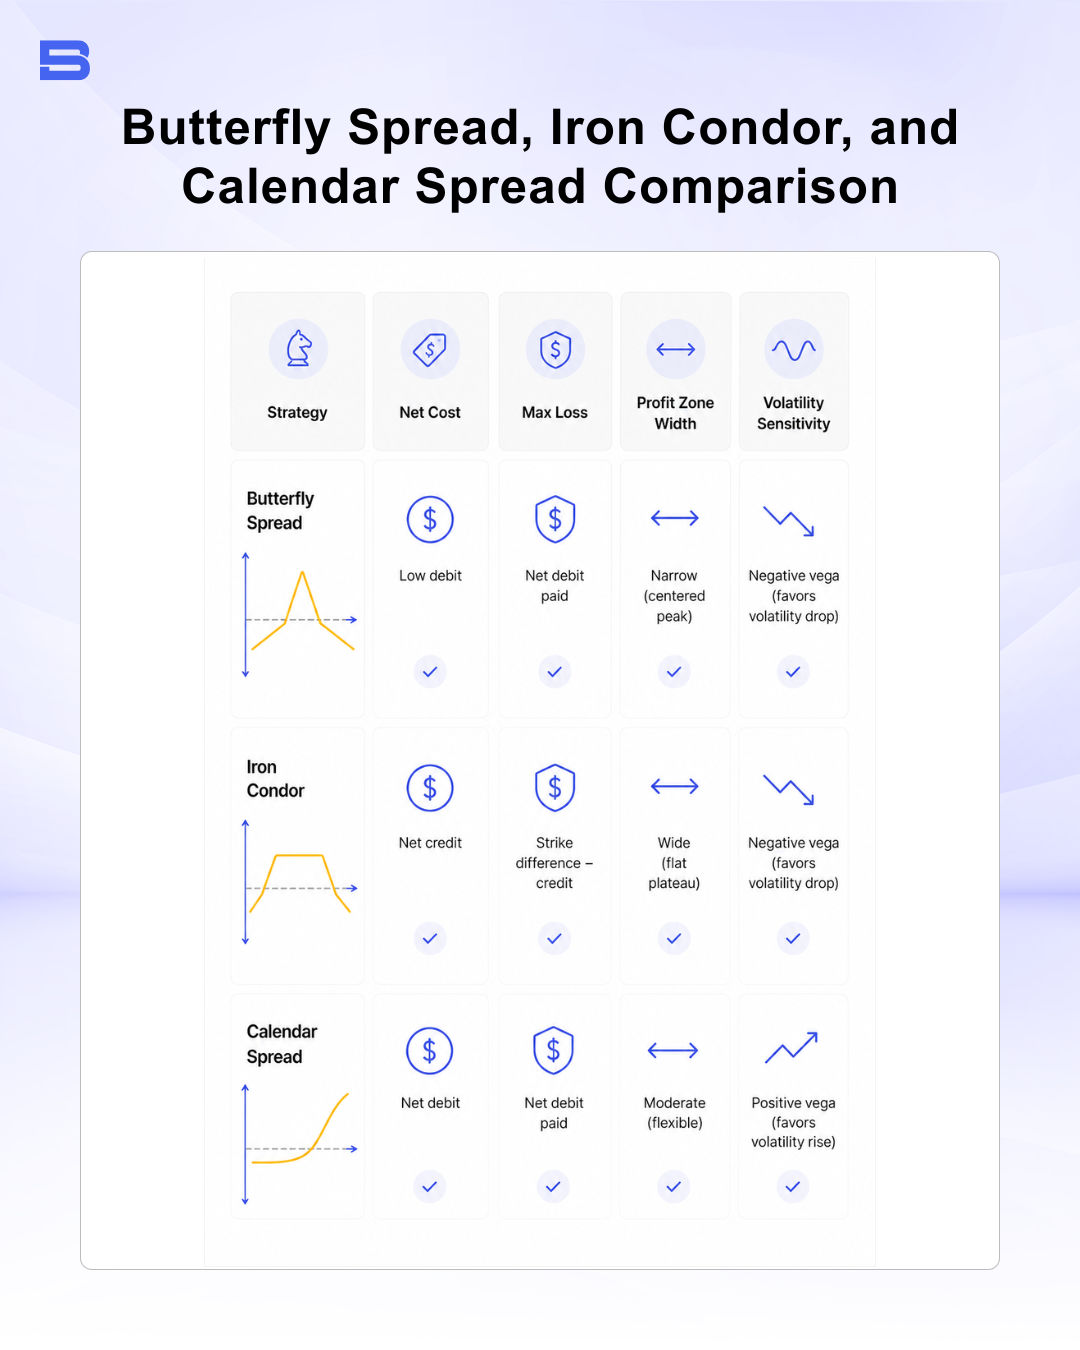
A butterfly spread offers a significantly higher reward-to-risk ratio than an iron condor due to its low initial cost, but it requires the underlying asset to remain within a narrower price band. Conversely, a calendar spread performs better when implied volatility is low and expected to rise, whereas debit butterflies benefit from declining volatility.
Summary of Strategy Application
The butterfly spread provides disciplined options traders with a precise mechanism for monetizing price consolidation. By structuring symmetrical wings around an expected price target, you achieve an exceptionally high reward-to-risk setup while maintaining absolute control over capital risk.
Success relies on selecting liquid underlying assets, identifying tight consolidation ranges, and managing expiration gamma risks proactively.
Disclaimer: The content on this page is intended for educational and informational purposes only. It does not constitute financial, investment, tax, or legal advice, and should not be interpreted as a recommendation to buy, sell, or hold any financial instrument or asset. Trading and investing involve significant risk, including the possible loss of your entire capital. Products such as forex, CFDs, and cryptocurrencies carry additional risks due to leverage, high volatility, and limited regulatory protection in some jurisdictions. Past performance of any financial instrument does not guarantee future results. Any market views, forecasts, or opinions expressed are those of the author at the time of writing and may not reflect current market conditions. Platform features, fees, and regulatory status are subject to change — always verify information directly with the relevant provider or regulator before making any financial decision. BrokerSpecs may receive compensation from third parties featured on this site. Always conduct your own due diligence and consider seeking advice from a licensed financial professional before investing.