


Related Tags
Walk across an institutional trading floor in mid-December, and the silence is unmistakable. Many trading desks run with reduced staff, trade volumes thin out, and some institutional books are locked for year-end performance reporting. Yet on financial media screens, a perennial buzz emerges every December about the "Santa Claus rally."
Traders often scramble to catch this seasonal drift, assuming that holiday cheer guarantees an effortless market tailwind. Equating historical calendar tendencies with risk-free execution is a fast track to capital destruction.
What Is the Santa Claus Rally and When Does It Occur?
The Santa Claus rally is a documented market anomaly where major equity indices have historically tended to rise across a specific seven-day trading span. The term was originally discovered and introduced by market analyst Yale Hirsch in the 1972 edition of the Stock Trader’s Almanac. Hirsch defined the rally not as a month-long celebration, but as a precise calendar phenomenon.
Exact Dates and the 7-Day Trading Window
Market commentators often muddy the definition by applying the label to any late-year momentum. Strictly speaking, the Santa Claus rally covers exactly seven trading sessions: the last five trading days of the calendar year and the first two trading sessions of January.
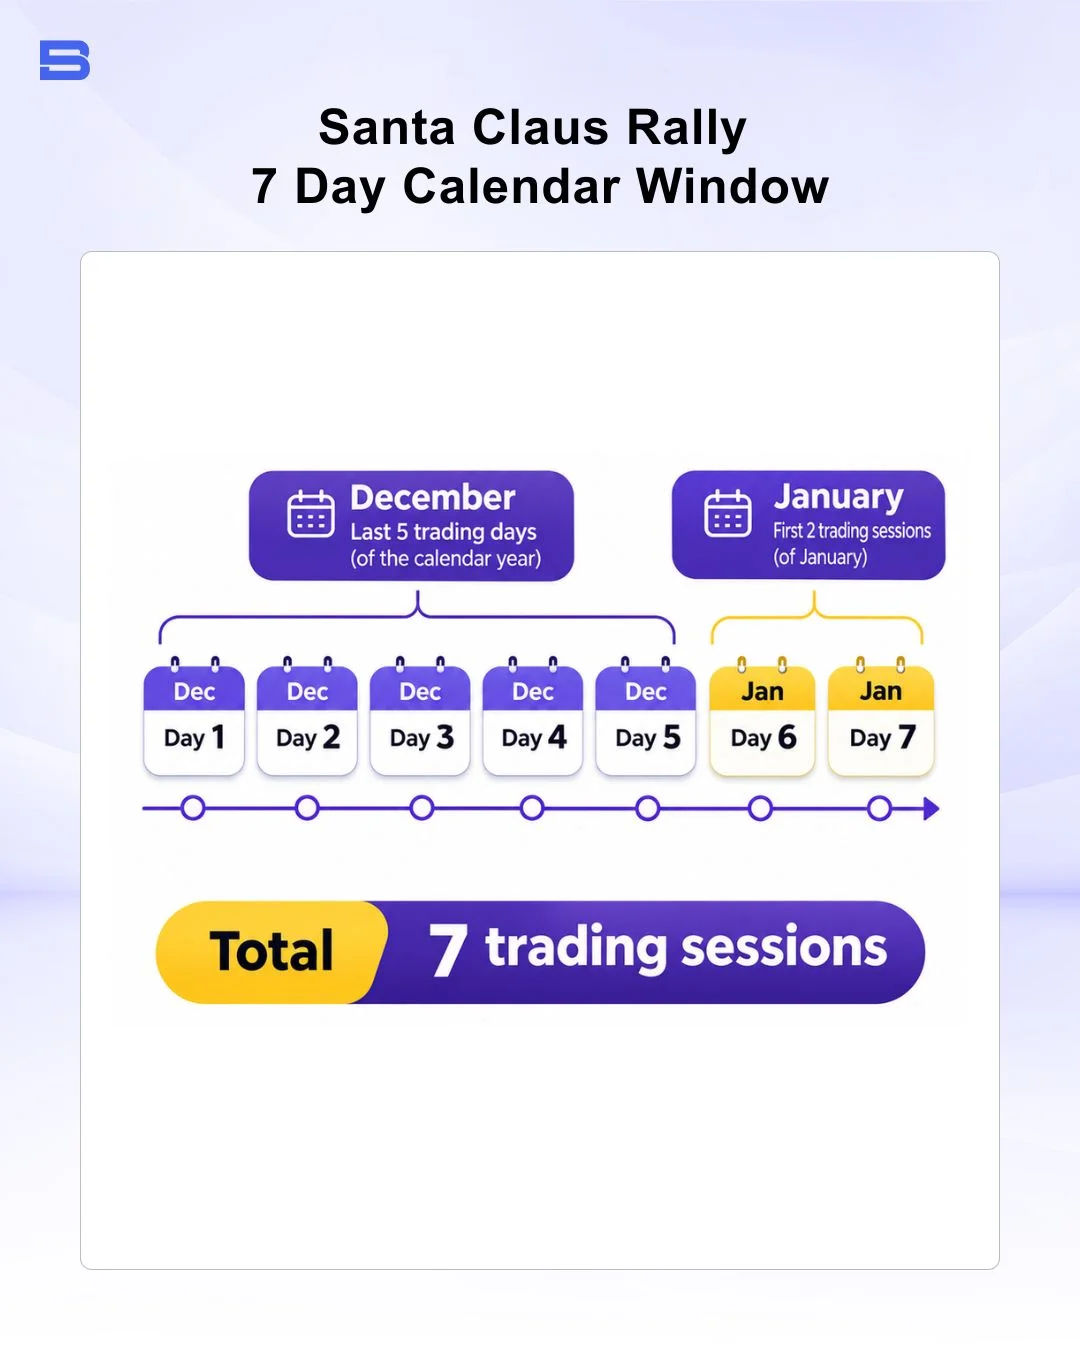
Because market holidays shift the calendar, these dates vary slightly each year. A common mistake is buying broad equities at the start of December expecting the anomaly to play out early. Seasonal edges exist only when applied within their strict empirical parameters.
Historical Win Rate and Average Return Data
Empirical data reveals why institutional desks monitor this calendar quirk. According to Stock Trader’s Almanac data, the S&P 500 has averaged a 1.3% gain in this window since 1950, well above the average for ordinary seven-day periods, though behavioral anomalies are best treated probabilistically rather than as reliable forecasting guarantees.
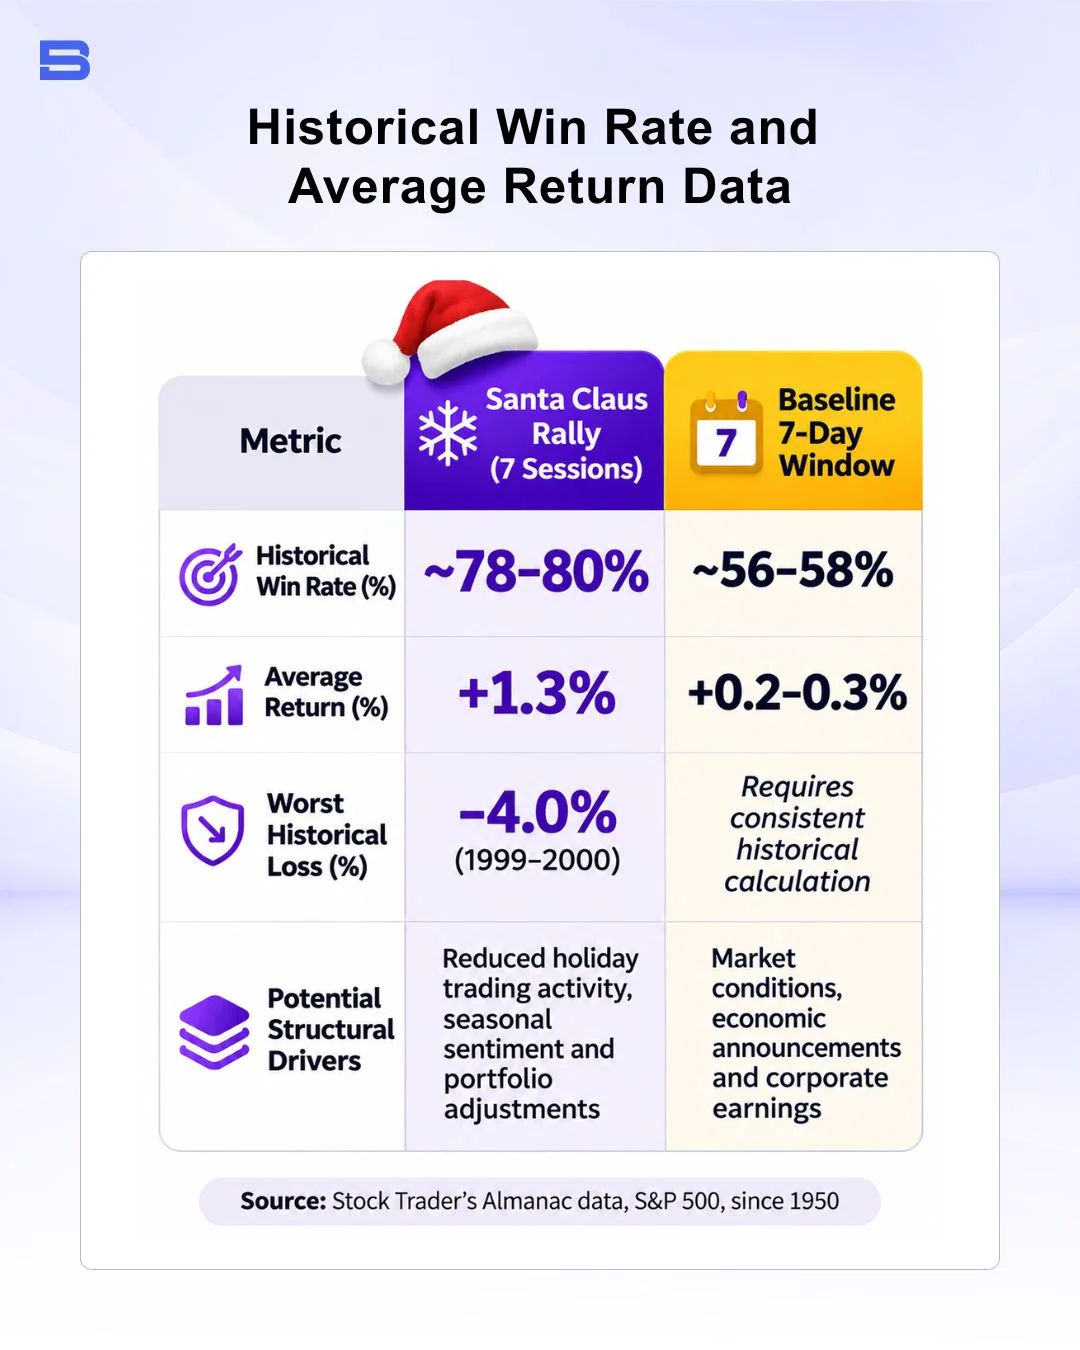
While a win rate of roughly 78% to 80% since 1950 (per Stock Trader’s Almanac data) sounds compelling on paper, seasonal patterns can fail sharply. Past performance never confirms or guarantees future gains, and entering positions without defined risk parameters leaves your portfolio exposed to sudden adverse swings.
What Causes a Santa Claus Rally in Financial Markets?
No single catalyst sparks the year-end lift. Instead, a structural shift in market mechanics combines with temporary investor psychology.
Tax-Loss Harvesting and Institutional Rebalancing
Throughout October and November, institutional fund managers often sell losing equities to offset realized capital gains for annual tax purposes. One commonly cited explanation is that once tax-loss harvesting wraps up in mid-December, this selling pressure may ease.
With sell orders exhausted, institutional desks frequently redeploy sideline liquidity into high-performing sectors to rebalance asset allocations before closing their books. This may create upward pressure on prices as market supply thins against steady baseline demand.
Retail Inflows, Holiday Bonuses, and Sentiment Shift
While institutional participation recedes, retail activity surges. Year-end bonuses, holiday cash gifts, and statutory retirement contributions begin funneling into the equities market.
Retail traders typically lean bullish, and this optimistic market sentiment may carry more weight in order flow when short-selling institutional algorithms are scaled back for the holidays.
Why Thin Holiday Liquidity Magnifies Slippage and Spread Risk
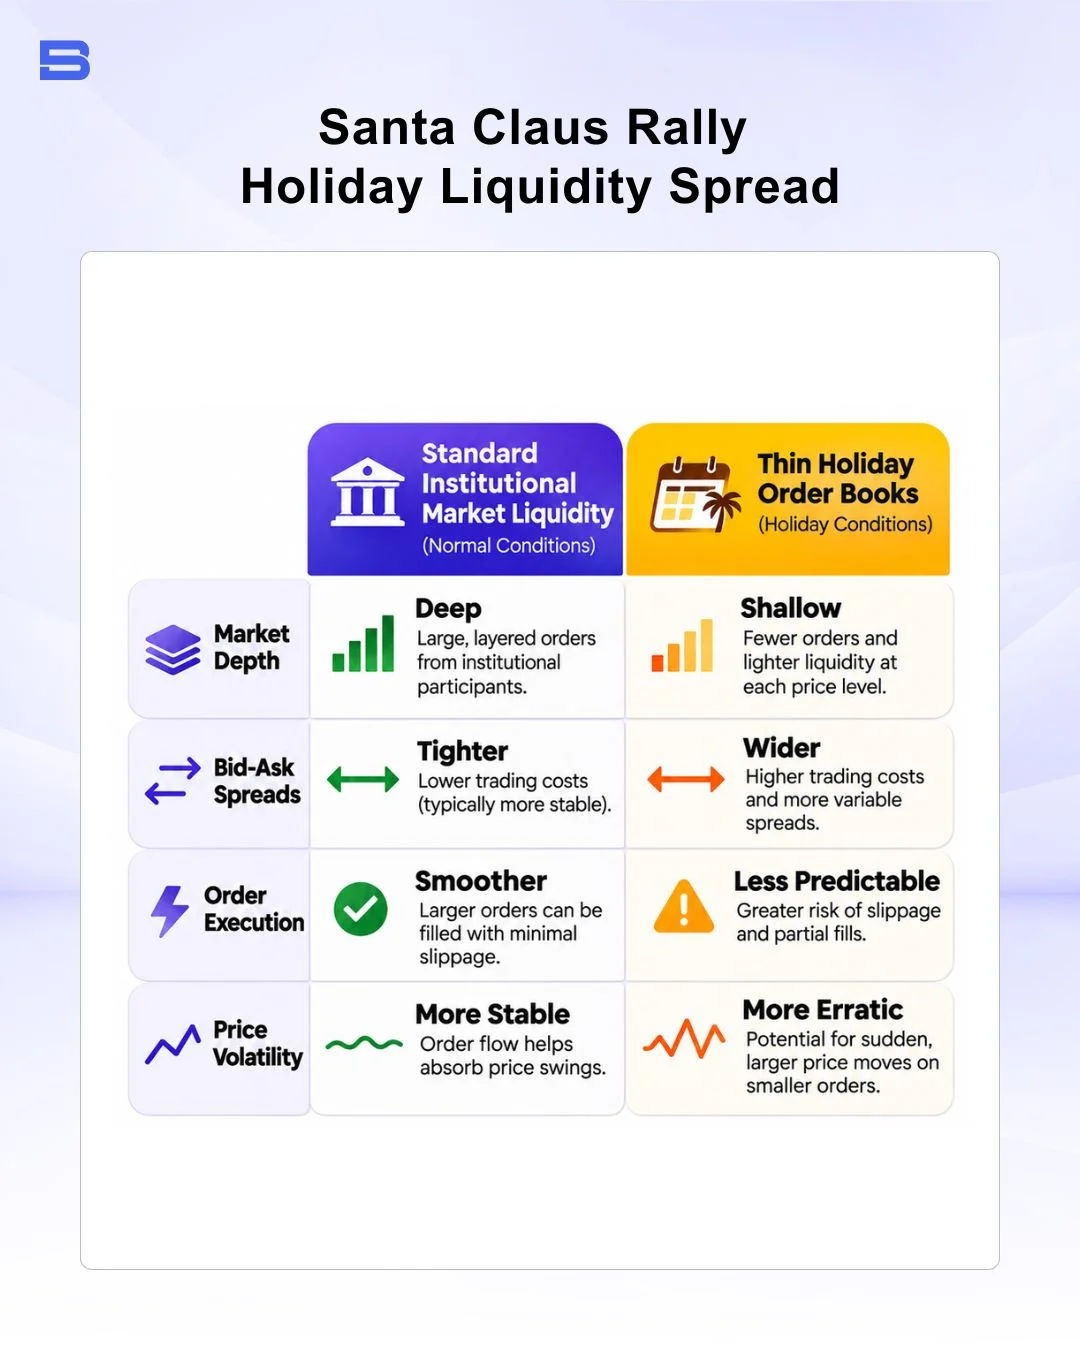
One trap that traders often overlook during the holiday trading session is liquidity starvation. As the US Securities and Exchange Commission (SEC) explains in its investor bulletin on extended-hours trading, reduced trading interest generally results in wider spreads between bid and ask prices, and thin holiday sessions can show a similar pattern.
When major institutional market makers pull their depth, the bid-ask spread widens across equities and index CFDs. A buy order that normally fills instantly can suffer slippage, which means it fills at a worse price than expected.
Moreover, low liquidity is a double-edged sword: minor order flow imbalances can cause sharp spikes in volatility. An intraday move that would normally be absorbed harmlessly into deep order books can trigger cascading stop losses on thin holiday desks.
Yale Hirsch’s Warning: Santa Claus Rally vs January Barometer
Traders often obsess over the rally’s upside, forgetting that Hirsch also offered a downside warning. His famous Wall Street adage states: "If Santa should fail to call, bears may come to Broad and Wall."
A flat or negative return over these seven days has historically coincided with weaker markets, which some analysts read as a sign of institutional stress. According to Stock Trader’s Almanac data, failed rallies preceded several major bear markets, including the 2000 dot-com crash (-4.0% rally window) and the 2008 global financial crisis (-2.5% rally window). When equities cannot muster a gain against thin holiday desks, it may indicate that institutions are reducing risk.
The Santa Claus rally should also not be confused with the "January Barometer." While the Santa Claus rally covers seven precise trading days, the January Barometer evaluates the entire calendar month of January to predict the market direction for the remaining 11 months. Treating these as interchangeable concepts leads to flawed risk modeling.
Practical Execution: How to Trade Year-End Seasonality Without Ignoring Risk
Trading seasonal tendencies requires disciplined risk budgeting rather than aggressive position sizing. Leverage amplifies your returns when you are right, but it accelerates capital destruction just as quickly when the market moves against you.
Consider a retail trader entering a long S&P 500 CFD position for the seven-day window. The index trades at 5,000, and the trader opens a 1-lot CFD contract using 20:1 leverage, requiring $250 in margin.
To execute safely:
- You identify your exit target: The historical average +1.3% return targets a price of 5,065, offering a potential $65 profit.
- You establish your protective stop loss: You place a hard stop at 4,960 (a 0.8% adverse move, or -$40 risk), establishing a favorable risk-reward ratio of roughly 1:1.6.
- You respect margin limits: If the rally fails and the market plunges 2% to 4,900, an unhedged position destroys $100—wiping out 40% of your allocated margin in an illiquid market. Predefined stop orders can help limit your portfolio drawdown regardless of seasonal optimism, although a stop may fill at a worse price than planned when liquidity is thin.
Key Takeaways: Combine Seasonality With Strict Risk Controls
The Santa Claus rally provides an intriguing statistical window into market behavior, but seasonal anomalies should never serve as a standalone basis for entering a trade. Real trading edge stems from pairing historical context with strict risk controls, verifying current market liquidity, and respecting position sizing.
Disclaimer: The content on this page is intended for educational and informational purposes only. It does not constitute financial, investment, tax, or legal advice, and should not be interpreted as a recommendation to buy, sell, or hold any financial instrument or asset. Trading and investing involve significant risk, including the possible loss of your entire capital. Products such as forex, CFDs, and cryptocurrencies carry additional risks due to leverage, high volatility, and limited regulatory protection in some jurisdictions. Past performance of any financial instrument does not guarantee future results. Any market views, forecasts, or opinions expressed are those of the author at the time of writing and may not reflect current market conditions. Platform features, fees, and regulatory status are subject to change — always verify information directly with the relevant provider or regulator before making any financial decision. BrokerSpecs may receive compensation from third parties featured on this site. Always conduct your own due diligence and consider seeking advice from a licensed financial professional before investing. Portions of this article were prepared with the assistance of AI tools and reviewed by our editorial team before publication.