


Related Tags
Two magnifying glasses over a price chart, one showing a +12.75% gain and the other an -8.43% loss, illustrating how the framing effect changes perception of the same market data
Imagine looking at two automated trading algorithms side by side. The first strategy is advertised as having a "90% winning trade rate," while the second comes with a warning highlighting a "10% losing trade rate." Many investors would likely pick the first option without hesitation, even though both descriptions reflect the same statistical profile.
That instinctive reaction illustrates the framing effect, a psychological mechanism in which identical numbers lead to opposite decisions based entirely on how the data is packaged.
What Is the Framing Effect in Finance and Trading?
The framing effect in finance occurs when an investor’s decision changes based on whether identical information is presented as a gain or a loss. Market facts remain mathematically neutral, but your brain processes them through a subjective contextual filter.
The effect was first documented by Amos Tversky and Daniel Kahneman in 1981. In their well-known study, participants chose between two programs to respond to a disease expected to kill 600 people.
When the options were described in terms of lives saved, most participants (about 72%) chose the certain outcome. When the identical options were described in terms of lives lost, most (about 78%) chose the gamble. Nothing about the underlying numbers changed. Only the wording did.
Financial institutions and marketing campaigns routinely leverage this cognitive shortcut. An investment firm might describe a fund as having "achieved capital preservation across 95% of volatile sessions" rather than highlighting that "investors faced capital loss in 5% of trading periods." When facts are framed around capital protection and upside potential, investors often underestimate the structural downside of the position.
Because misleading presentation can push retail participants into taking excessive exposure, the voluntary Global Investment Performance Standards (GIPS), maintained by CFA Institute, call for fair representation and full disclosure when firms present performance. Recognizing that data presentation is rarely accidental helps you analyze opportunities based on statistical expectancy rather than marketing language.
Why Traders Fall for Framing: Prospect Theory and Cognitive Bias in Trading
The psychological root of framing bias lies in prospect theory, developed by behavioral economists Daniel Kahneman and Amos Tversky in 1979. Their research revealed that the human mind does not evaluate market outcomes on an absolute wealth scale. Instead, you evaluate results relative to a neutral reference point, and you perceive gains and losses with unequal emotional intensity.
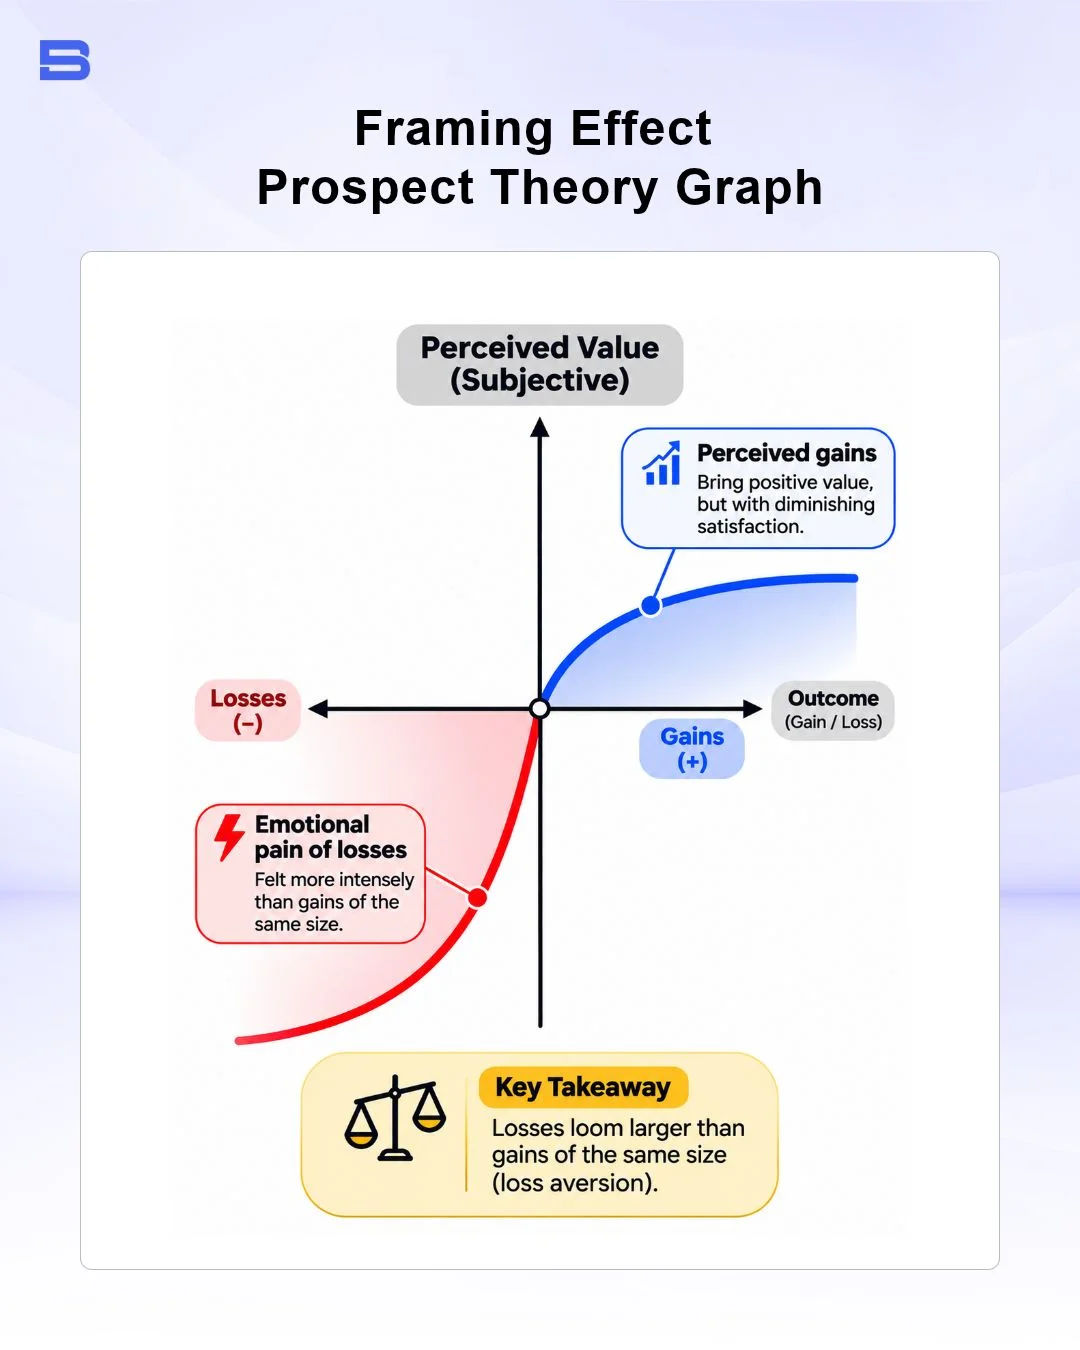
Prospect theory shows that individuals tend to exhibit asymmetric risk attitudes:
- Risk-Averse in the Domain of Gains: When a setup is framed around securing positive returns, traders look to lock in profits quickly to protect their win.
- Risk-Seeking in the Domain of Losses: When faced with a potential negative outcome, traders actively gamble to avoid realizing that financial pain.
This cognitive bias in trading explains why you might exit a solid trending trade prematurely for a small $50 profit, yet let an open loss drift down to -$500, hoping price returns to breakeven. Behavioral finance calls this pattern the disposition effect. Developing a resilient trading mindset requires acknowledging this natural asymmetry and following a rules-based system rather than emotional instincts.
Framing Effect vs. Loss Aversion: What Is the Difference?
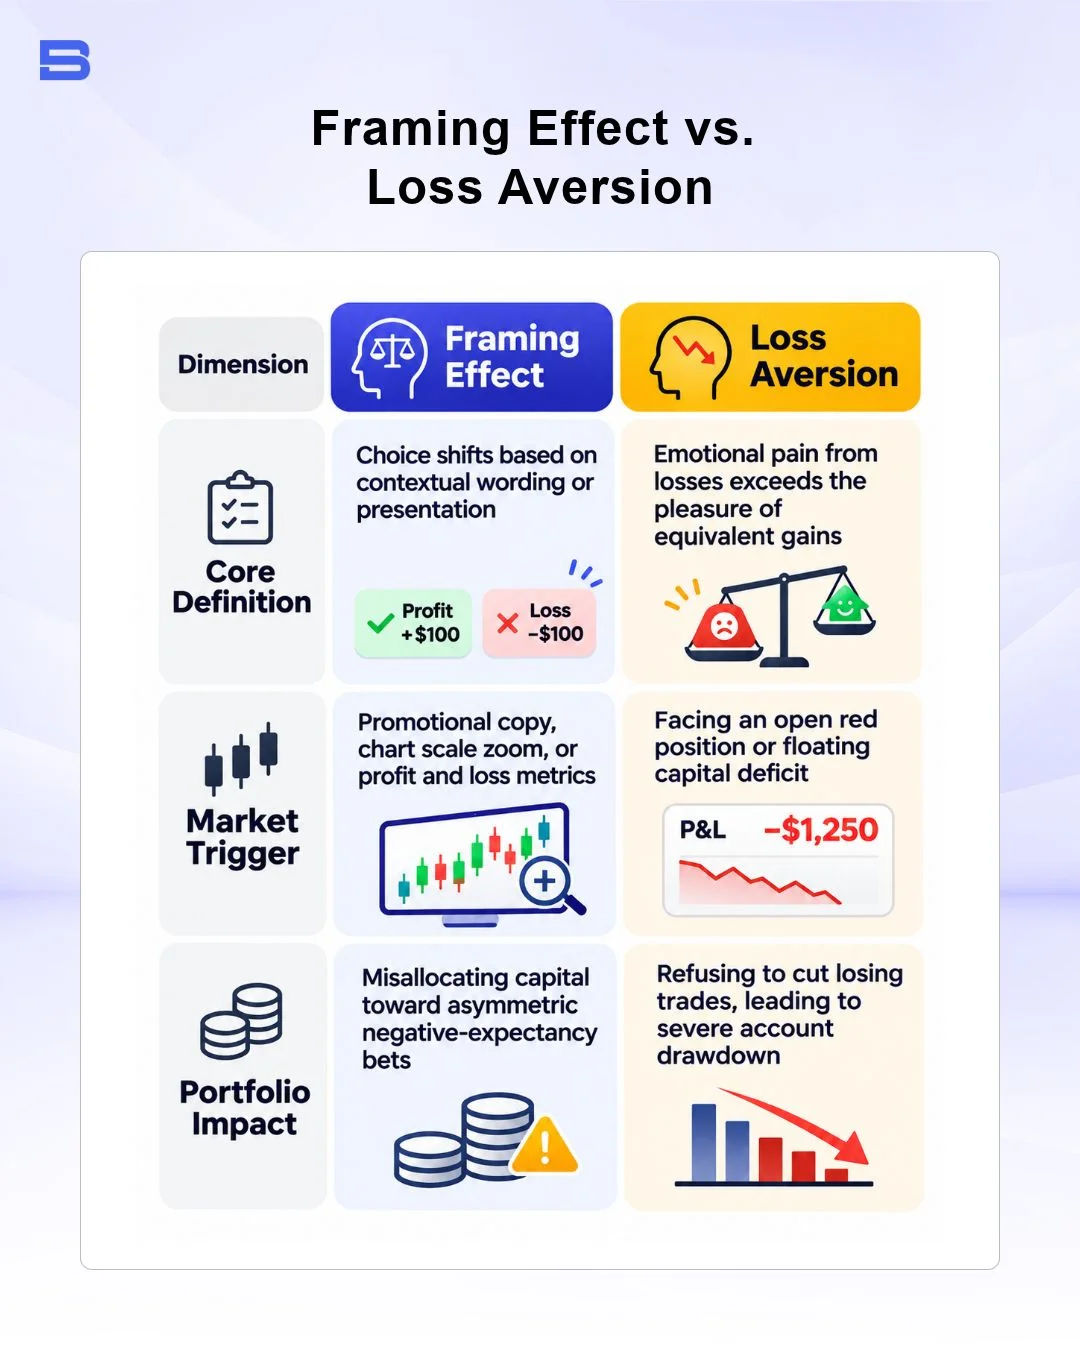
While closely connected, the framing effect and loss aversion describe distinct behavioral mechanics. Loss aversion refers to the finding, estimated in Kahneman and Tversky’s research (Tversky and Kahneman, 1992, Journal of Risk and Uncertainty), that losses typically feel roughly twice as powerful as equivalent gains. The framing effect, by contrast, describes how the presentation of identical information changes the choice. Framing often works because loss aversion is already there: describe an outcome as a loss, and you trigger the stronger emotional response.
Framing Bias Examples: How Market Presentation Skews Decisions
Researchers describe three main types of framing: risky-choice framing, attribute framing, and goal framing (Levin, Schneider and Gaeth, 1998). The examples below show how the first two appear in everyday trading, plus one practical extension related to chart timeframes.
To see framing bias examples in action, consider how a trader evaluates risk when selecting between two distinct trading systems:
- Setup A: 90% win rate, risking $1,000 on each trade to generate a $100 profit.
- Setup B: 40% win rate, risking $100 on each trade to generate a $300 profit.
A novice trader drawn to positive gain framing often gravitates toward Setup A because of the phrase "90% win rate." That label is the frame: it spotlights how often you win and hides how much a single loss costs, which is why traders also check the risk-reward ratio alongside win rate. The mathematical expectancy per trade works out as follows:
Setup A: (0.90 x $100) - (0.10 x $1,000) = $90 - $100 = -$10 per trade
Setup B: (0.40 x $300) - (0.60 x $100) = $120 - $60 = +$60 per trade
Over 10 trades, this works out to an expected total of -$100 for Setup A and +$600 for Setup B.
Despite winning nine times out of ten, Setup A slowly erodes your portfolio through negative expectancy. Conversely, Setup B loses most of the time but, in this hypothetical example, produces a positive expectancy. These figures are illustrative only. Real results vary, and no strategy is guaranteed to remain profitable.
When traders ignore this math and focus purely on high win streaks, they often fall into the hot-hand fallacy, mistakenly assuming a run of consecutive wins makes an account invincible. The opposite error is the gambler’s fallacy, which is expecting a streak to reverse simply because it has lasted a while.
Gain-Loss Framing: Why a 90% Win Rate Can Conceal Large Losses
High-win-rate strategies frequently rely on tight profit targets coupled with wide or non-existent stop losses. In leveraged foreign exchange and derivatives markets, gain-loss framing can hide the risk of rare but severe losses.
Leverage amplifies your returns when you are right, but it accelerates capital destruction just as quickly when the market moves against you. In a hypothetical example, a strategy with a 90% win rate at 30:1 leverage could lose about 75% of its account margin in a single unexpected gap event, because a price move of roughly 2.5% against a 30:1 position produces that loss.
The emotional comfort of constant small wins can create a false sense of security that may last until a rare but large loss occurs.
Attribute Framing and Broker Marketing Spin
Attribute framing highlights a single positive operational feature while downplaying surrounding trade friction. A brokerage platform might advertise "99.2% ultra-fast execution speeds" while downplaying that execution fills during volatile news events suffer substantial slippage.
In the UK, the Financial Conduct Authority (FCA) requires regulated firms to ensure communications and financial promotions are fair, clear, and not misleading (Conduct of Business Sourcebook, COBS 4.2). As an independent market participant, evaluate platforms based on all-in execution costs, including spreads, swap rates, and commissions, rather than isolated marketing claims.
Time-Horizon Framing in Chart Analysis
Chart construction can also alter your market perception. This is a practical extension of the framing idea rather than one of the three classic types, and it is closely related to myopic loss aversion (Benartzi and Thaler, 1995): the more often and the more closely you look, the more noise feels like signal. When you open a one-minute chart, a sudden 15-pip intraday spike can look like a sharp breakout that seems to call for an immediate entry.
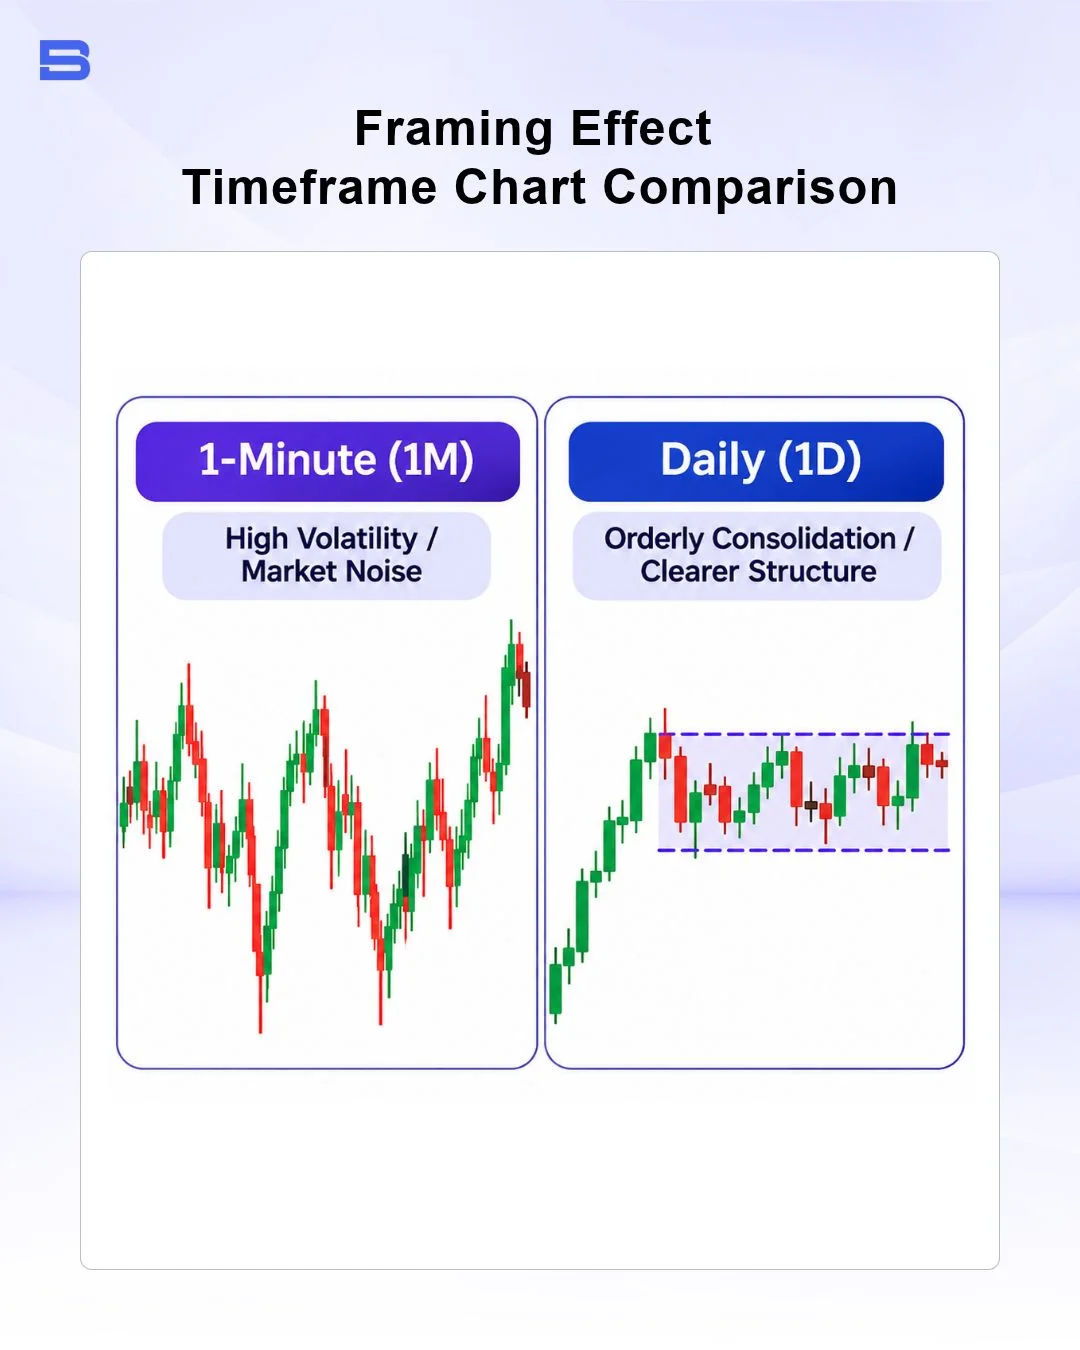
However, shifting to a four-hour or daily chart frames that same price action as minor, inconsequential market consolidation. Over-focusing on short timeframes can frame market noise as high-conviction momentum, which may nudge traders into impulsive entries they later regret.
How Can Investors Avoid Framing Bias? A Practical Mitigation Checklist
Neutralizing the framing effect requires deliberate processes that strip marketing rhetoric and perceptual distortion from your decision-making:
- Restate Data in Reverse Terms: Whenever you encounter an investment pitch or setup framed as an upside opportunity, rewrite it from the loss perspective. If a system boasts an 80% success rate, actively evaluate how your risk plan handles the 20% failure rate.
- Review Metrics in Both Percentages and Absolute Dollars: Seeing a 1.5% drawdown on a large position can feel manageable, but converting that into a -$3,000 cash loss brings the true risk into clear focus. Evaluate every position size in both formats before submitting an order.
- Use Fixed System Rules to Prevent Overtrading: Establish a predefined checklist detailing stop loss, take profit, and position sizing parameters. Standardized parameters can reduce situational framing and help prevent overtrading during active trading sessions.
- Log Triggers in a Trading Journal: Keep a detailed trading journal that tracks the emotional context of your entries. Documenting psychological impulses can help keep emotional momentum from spiraling into revenge trading after unexpected drawdowns.
Structured decision-making processes cannot guarantee trading profits, but they build the discipline needed to protect your capital across shifting market conditions.
Conclusion: Reframe the Data Before You Trade
Financial market quotes and technical charts are inherently neutral pieces of data. The distortions arise only from the psychological lens you use to interpret them. By systematically reframing trading setups and adhering to strict risk boundaries, you can base decisions on verifiable statistical probabilities rather than misleading presentation traps.
Disclaimer: The content on this page is intended for educational and informational purposes only. It does not constitute financial, investment, tax, or legal advice, and should not be interpreted as a recommendation to buy, sell, or hold any financial instrument or asset. Trading and investing involve significant risk, including the possible loss of your entire capital. Products such as forex, CFDs, and cryptocurrencies carry additional risks due to leverage, high volatility, and limited regulatory protection in some jurisdictions. Past performance of any financial instrument does not guarantee future results. Any market views, forecasts, or opinions expressed are those of the author at the time of writing and may not reflect current market conditions. Platform features, fees, and regulatory status are subject to change — always verify information directly with the relevant provider or regulator before making any financial decision. BrokerSpecs may receive compensation from third parties featured on this site. Always conduct your own due diligence and consider seeking advice from a licensed financial professional before investing. Portions of this article were prepared with the assistance of AI tools and reviewed by our editorial team before publication.