


Related Tags
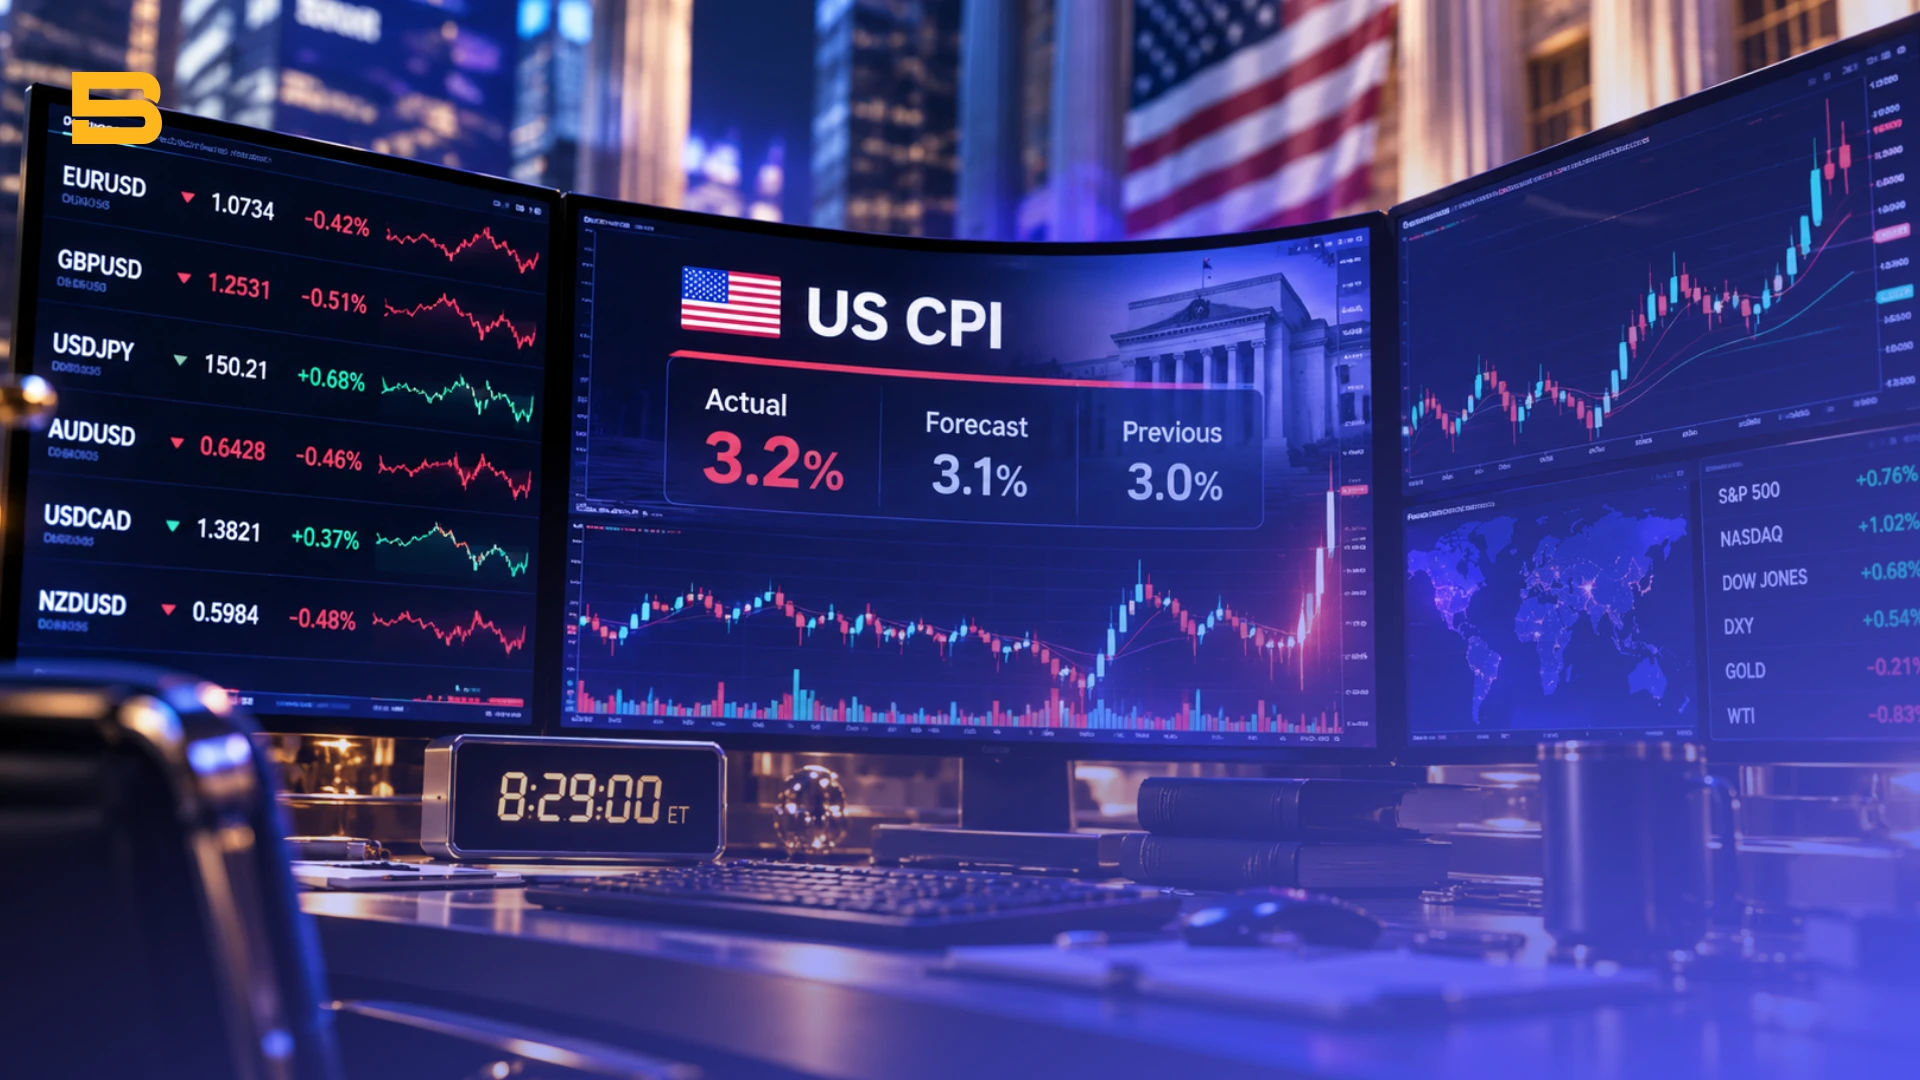
It is 8:29 AM Eastern Time on release day, and your trading terminal shows bid-ask spreads widening across major currency pairs. Seconds later, the headline number flashes across the wires, triggering sudden price swings and volume surges. When the US Consumer Price Index drops, financial markets reprice interest rate expectations within fractions of a second.
What Is the US CPI and Why Does It Move Global Markets?
The US Consumer Price Index (CPI) is a monthly benchmark measuring price changes across a representative basket of goods and services. Published monthly by the US Bureau of Labor Statistics (BLS), this metric tracks expenditure categories including housing, transportation, and food. It serves as the primary gauge of consumer purchasing power and domestic price stability.
Financial markets watch the US CPI report closely because inflation directly governs modern monetary policy. Alongside nonfarm payrolls, US CPI data forms the foundational evidence that central bankers examine when setting borrowing costs. An unexpected acceleration in price pressures forces capital allocators to adjust portfolio valuations immediately.
Because the US Dollar serves as the primary global reserve currency, American inflation figures carry significant cross-border implications. A shifting inflation trajectory alters international trade balances, sovereign bond yields, and commodity valuations worldwide. Understanding the US CPI report gives you essential insight into where broad market liquidity will flow next.
Each CPI US release follows a fixed calendar that the BLS publishes in advance, so traders can plan around it. The next US CPI release date is November 10, 2026, at 8:30 AM Eastern Time, covering October 2026 data.
US CPI vs. Core CPI: Key Differences Traders Must Know
When analyzing headline US CPI figures, you are viewing the aggregate index across every tracked retail category. This overarching number reflects total household expenditure shifts, meaning rapid spikes in crude oil or food shortages immediately skew the reading. While consumers feel these price swings daily, central bank policy makers often view headline volatility as temporary economic noise.
Core CPI deliberately strips out food and energy costs to provide a clearer view of underlying structural inflation. Energy and raw food components fluctuate widely due to geopolitical conflict, seasonal weather shocks, and shipping disruptions that interest rates cannot easily solve. By eliminating those volatile elements, Core CPI highlights persistent price pressures in sticky categories such as shelter and healthcare.
Professional traders track the divergence between headline and core US CPI to gauge monetary policy duration. A scenario where headline inflation falls while core inflation remains elevated tells you that sticky service prices are resisting central bank rate adjustments. Paying attention to both numbers prevents you from misinterpreting a brief decline in fuel costs as a genuine structural victory over inflation.
How to Read and Interpret US CPI Data
Reading monthly reports requires you to evaluate month-over-month (MoM) and year-over-year (YoY) metrics against institutional consensus forecasts. The annual YoY US CPI figure indicates long-term directional momentum, but short-term asset prices react almost entirely to monthly deviations from consensus estimates. Markets already price in consensus projections, so only unexpected surprises create sharp repricing or sudden drawdowns.
Consider a scenario where economists anticipate US CPI MoM inflation of 0.2%, but the actual print lands at 0.5%. That positive 0.3% surprise signals that price growth is accelerating faster than institutional models predicted. In such a scenario, algorithmic desks may buy the US Dollar and sell government bonds within milliseconds. That could lift benchmark 10-year Treasury yields by roughly 12 basis points (0.12%, an illustrative figure) as traders price out near-term rate cuts.
You must also account for statistical base effects when evaluating headline year-over-year US CPI figures. If inflation was exceptionally high 12 months earlier, moderate monthly price increases can make the annual comparison look artificially subdued. Examining underlying components prevents you from mistaking mathematical base effects for true economic stabilization.
The Direct Link Between US CPI and FOMC Interest Rate Decisions
The Federal Reserve operates under a dual mandate: achieving maximum employment and maintaining stable prices, defined as a 2% long-term inflation target. When inflation data persistently exceeds this objective, the Federal Open Market Committee (FOMC), the Federal Reserve’s rate-setting body, may raise the federal funds rate or hold borrowing costs higher for longer. Higher policy rates increase debt servicing costs for corporations and curb broad macroeconomic demand.
Conversely, consistent prints showing consumer disinflation (inflation that is still positive but slowing) provide policy makers with justification to implement a Federal Reserve interest rate cut. Lower borrowing benchmarks stimulate business investment and credit creation, providing liquidity that supports risk assets. The dot plot, published quarterly with the Federal Reserve’s Summary of Economic Projections, shows how committee members expect policy to evolve as inflation data shifts.
How US CPI Surprises Can Move Bonds, Currencies, and Stocks
Bond markets continuously recalibrate future rate paths through federal funds futures, which are contracts whose prices reflect where traders expect the federal funds rate to be. An unexpectedly hot print can compress expectations for policy easing, which may push bond yields higher across the curve. Monitoring this transmission channel helps you identify whether prevailing market sentiment favors capital preservation or speculative risk-taking.
How US CPI Affects Forex and Stock Markets
Currency valuations respond swiftly to US CPI releases because international capital migrates toward economies offering higher risk-adjusted yields. When inflation beats forecasts, expectations of tighter central bank policy may lift the DXY US Dollar Index against major currencies like the Euro and Japanese Yen. Conversely, softer inflation data often sparks broad Dollar depreciation as global yield differentials narrow.
Equity markets frequently experience valuation compression during periods of persistent, above-target inflation. Higher projected interest rates elevate corporate borrowing expenses and increase the discount rate applied to future corporate earnings, disproportionately hurting growth equities. However, cash-rich defensive sectors or energy firms may remain resilient, producing sharp sector rotation rather than uniform market declines.
Global trade networks mean the latest US CPI print can generate ripple effects across international markets, as documented by the International Monetary Fund (IMF). Emerging market currencies can face capital outflow pressures when rising US yields strengthen the greenback, which may prompt overseas central banks to tighten domestic credit conditions. These cross-border pressures can directly influence regional price stability, ultimately impacting benchmarks such as Malaysia’s inflation rate.
Navigating CPI Release Volatility and Slippage Risk
The opening seconds of a high-impact inflation release present significant operational risks for retail participants. Institutional market makers routinely pull liquidity from the order book fractions of a second before the 8:30 AM Eastern Time release. This protects their capital from one-sided order flow, meaning a rush of orders in the same direction that leaves them on the losing side of each trade. With resting orders vanishing, the gap between the best available bid and ask price expands dramatically across both forex and futures venues.
Spread widening creates substantial negative slippage, meaning your stop-loss order may fill significantly worse than your predefined level during rapid price gapping. Traders who attempt to trade news breakouts frequently encounter situations where sudden whipsaws trigger both buy and sell stops within the same minute. While high volatility offers profit opportunities when directional momentum aligns with your bias, it also accelerates capital losses when market velocity breaks through risk limits.
Prudent risk management requires lowering your position sizing or stepping aside entirely until initial liquidity re-enters the market. Waiting 10 to 15 minutes after the initial print allows spreads to normalize and reveals genuine institutional order flow rather than emotional retail chasing. Preserving capital during volatile data windows is far more important than attempting to capture the initial 30-second impulse move.
Trading Inflation Data With Patience and Risk Control
Tracking the US Consumer Price Index gives you a clear window into how central bank policy will shape market liquidity and asset pricing. Understanding US CPI core components, consensus forecasts, and cross-asset dynamics enables you to interpret economic momentum objectively rather than gambling on headlines. Consistent profitability depends on managing high-volatility execution risks, controlling position size, and letting institutional liquidity settle before taking action.
Disclaimer: The content on this page is intended for educational and informational purposes only. It does not constitute financial, investment, tax, or legal advice, and should not be interpreted as a recommendation to buy, sell, or hold any financial instrument or asset. Trading and investing involve significant risk, including the possible loss of your entire capital. Products such as forex, CFDs, and cryptocurrencies carry additional risks due to leverage, high volatility, and limited regulatory protection in some jurisdictions. Past performance of any financial instrument does not guarantee future results. Any market views, forecasts, or opinions expressed are those of the author at the time of writing and may not reflect current market conditions. Platform features, fees, and regulatory status are subject to change — always verify information directly with the relevant provider or regulator before making any financial decision. BrokerSpecs may receive compensation from third parties featured on this site. Always conduct your own due diligence and consider seeking advice from a licensed financial professional before investing. Portions of this article were prepared with the assistance of AI tools and reviewed by our editorial team before publication.