



Related Tags
At 8:30 AM on the first business day of the month, trading desks across Kuala Lumpur monitor incoming terminal alerts. When factory survey numbers deviate from consensus forecasts, asset prices adjust rapidly. Tracking PMI Malaysia gives you an early read on industrial momentum before quarterly government data arrives.
What Is Malaysia PMI and How Is It Measured?
PMI Malaysia is a monthly survey-based macroeconomic indicator that tracks private-sector manufacturing health, where readings above 50.0 signal expansion and readings below signal contraction. Published by S&P Global, the index translates direct operational responses from purchasing executives into a composite metric.
The PMI Malaysia indicator operates as a diffusion index centered on the neutral 50.0 baseline. Figures above 50.0 indicate expanding factory activity compared to the prior month, while prints below 50.0 mark contraction. A level of 50.0 indicates unchanged operating conditions.
Traders track macroeconomic indicators because survey results are published ahead of official production data, giving an early read on industrial conditions. A decisive monthly shift often alters short-term positioning across domestic equities and foreign exchange desks.
What Does a PMI Above 50 Mean for Market Expansion?
A PMI above 50 indicates that more surveyed manufacturers reported month-on-month improvement than deterioration. However, the absolute level tells only part of the story. The rate of change between consecutive releases reveals whether expansion is accelerating or decelerating.
A drop from 53.0 to 50.5 still reflects expansion, yet it marks a loss of momentum. Conversely, a climb from 46.0 to 49.0 remains in contraction territory, but the upward trajectory signals potential bottoming behavior.
Understanding the PMI Survey Methodology from S&P Global
The PMI Malaysia survey pools purchasing executives across approximately 400 manufacturing establishments in Malaysia. S&P Global selects participants to reflect national gross domestic product contributions across heavy manufacturing, electronics, and consumer goods.
Managers report whether output, incoming orders, and employment increased, decreased, or remained unchanged. Diffusion surveys can capture turning points quickly because procurement managers often adjust material orders before assembly lines change. Seasonal adjustment algorithms filter out recurring calendar distortions, such as Lunar New Year shutdowns.
Decoding the Malaysia Manufacturing PMI Components
The headline Malaysia Manufacturing PMI is calculated from five distinct survey pillars rather than a single general sentiment poll. Each sub-index carries a specific weight reflecting its empirical relationship with physical production.
The headline score allocates 30% to New Orders, 25% to Output, 20% to Employment, 15% to Suppliers' Delivery Times, and 10% to Stocks of Purchases. Delivery times are inverted in the calculation. Longer delivery times historically denote supplier capacity strain and solid demand rather than logistical failure.
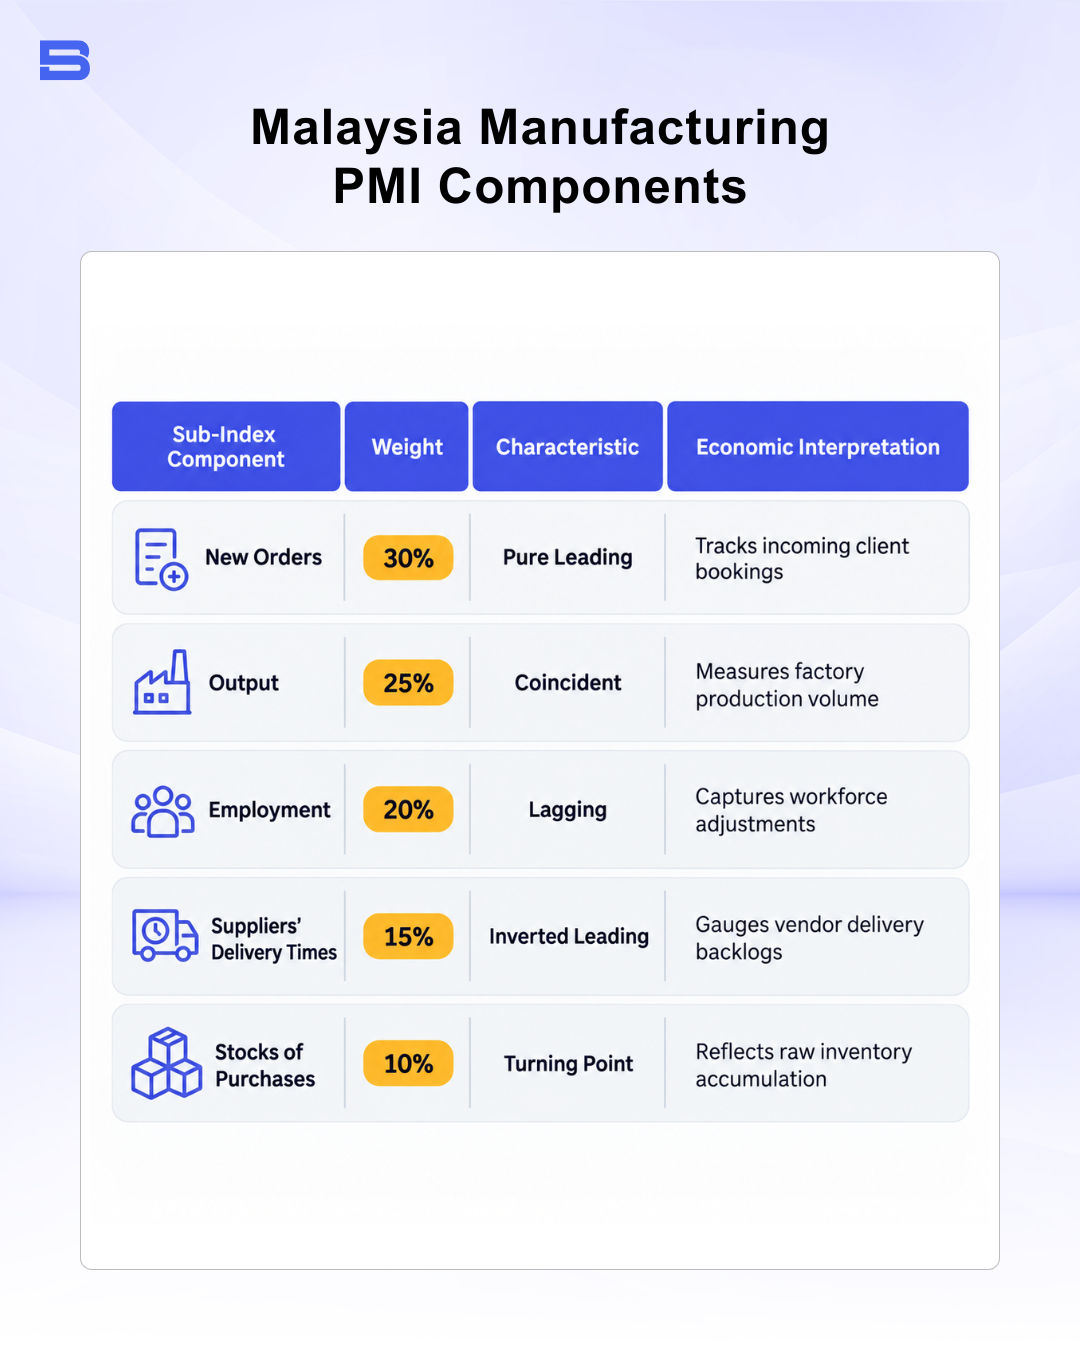
Internal divergences among these sub-indices reveal cyclical turning points before the headline index moves. If the headline sits above 50.0 while new orders shrink and inventories surge, factories are accumulating unsold goods. That mismatch typically forces production cuts in subsequent quarters.
How Malaysia PMI Affects the Ringgit and Bursa Malaysia
Asset managers and currency desks adjust exposures when PMI Malaysia numbers deviate from consensus expectations. An upside beat frequently drives capital into industrial equities listed on Bursa Malaysia. Simultaneously, expanding manufacturing data supports speculative interest in the Malaysian Ringgit.
Macro analysts assess how sustained manufacturing growth shapes monetary policy deliberations at Bank Negara Malaysia (BNM). Persistent expansion alongside elevated capacity utilization can generate pipeline inflation and push up the Malaysia inflation rate. Pipeline inflation refers to price pressure building in the supply chain before it shows up in consumer prices. Under these conditions, fixed-income markets may begin pricing in potential rate hikes for the overnight policy rate (OPR) in Malaysia to prevent overheating.
Conversely, readings entrenched below 50.0 signal industrial cooling and can trigger Ringgit weakness. Knowing how PMI affects Ringgit movements helps traders navigate exchange rate swings during active market hours. Export manufacturers may see short-term margin benefits from a weaker currency, but broad equity sentiment usually retreats during prolonged contractions. Because manufactured goods make up a large share of Malaysia exports, a weak PMI can also hint at pressure on the Malaysia trade balance.
S&P Global Malaysia PMI Release Schedule and Market Reaction
The survey data is published on the first business day of each month at 8:30 AM local Kuala Lumpur time (0030 UTC). Institutional participants focus primarily on the gap between actual PMI Malaysia releases and consensus projections.
Liquid assets like USD/MYR pairs and FTSE Bursa Malaysia KLCI Index Futures (FKLI) often experience immediate spread widening at release. Leveraged derivative traders must account for brief liquidity gaps during the opening seconds. An unexpected upside print can trigger short covering, while sharp contraction numbers can prompt rapid liquidations. Short covering means traders who sold an asset short buy it back to close the position, which can briefly lift prices.
Interpreting PMI Divergences and Business Cycle Traps
Relying entirely on headline figures without analyzing the underlying sub-indices can lead you to misread the signal. Survey responses reflect subjective sentiment rather than audited financial accounts. In periods of currency volatility, purchasing managers may report conservative sentiment even while factory shipments hold firm.
Consider a market scenario where headline PMI prints at 51.5, suggesting solid expansion. You might read this headline as an immediate signal to buy manufacturing shares and sell USD/MYR. However, looking beneath the headline reveals that factory output sits at 52.0 while export new orders have fallen to 47.8.
Current production is supported entirely by clearing legacy backlogs, while future demand is contracting. Traders entering long positions on the headline figure face severe downside risk when backlogs run dry. Using leverage amplifies this risk: it magnifies returns on accurate positioning, but it magnifies losses just as quickly when momentum reverses.
Correlating PMI with the Industrial Production Index
To confirm whether survey sentiment reflects real physical output, disciplined traders cross-reference PMI data against the Industrial Production Index. The Industrial Production Index (IPI) published by the Department of Statistics Malaysia (DOSM) tracks physical manufacturing volume.
While PMI serves as a fast-moving leading indicator, the IPI verifies whether managers converted sentiment into delivered goods. Tracking this relationship alongside the consumer confidence index reveals whether domestic demand can absorb current production. When optimistic PMI prints are not confirmed by hard IPI data over the following months, equity rallies may lose steam. In a PMI vs GDP comparison, S&P Global reports that the headline index has a correlation of about 60% with annual Malaysia GDP growth.
Reading Beneath the Headline PMI
PMI Malaysia provides an essential early read on industrial cycles and macroeconomic health. Actionable analysis requires looking beneath headline numbers to evaluate sub-index trends and confirming soft survey findings against hard industrial production figures. Combining macroeconomic awareness with strict risk limits and position sizing can help limit losses from false breakouts and cyclical reversals.
Disclaimer: The content on this page is intended for educational and informational purposes only. It does not constitute financial, investment, tax, or legal advice, and should not be interpreted as a recommendation to buy, sell, or hold any financial instrument or asset. Trading and investing involve significant risk, including the possible loss of your entire capital. Products such as forex, CFDs, and cryptocurrencies carry additional risks due to leverage, high volatility, and limited regulatory protection in some jurisdictions. Past performance of any financial instrument does not guarantee future results. Any market views, forecasts, or opinions expressed are those of the author at the time of writing and may not reflect current market conditions. Platform features, fees, and regulatory status are subject to change — always verify information directly with the relevant provider or regulator before making any financial decision. BrokerSpecs may receive compensation from third parties featured on this site. Always conduct your own due diligence and consider seeking advice from a licensed financial professional before investing. Portions of this article were prepared with the assistance of AI tools and reviewed by our editorial team before publication.