



Related Tags
At 10:00 AM Eastern Time on the first business day of every month, institutional order books thin out across major currency desks. Live spreads momentarily widen on EUR/USD and USD/JPY as algorithms pause in anticipation of fresh macroeconomic data. Within fractions of a second, the monthly release of the ISM manufacturing report triggers immediate portfolio rebalancing across global equities, fixed income, and currency pairs.
Because it arrives days before government payroll and industrial output statistics, this indicator offers an early, widely watched read on industrial demand. Tracking its monthly shifts allows you to evaluate broader economic momentum before official revisions appear.
What Is ISM Manufacturing PMI and Why Does It Move Markets?
The ISM Manufacturing PMI is a monthly diffusion index compiled by the Institute for Supply Management that tracks prevailing economic trends in US factory activity. Based on surveyed purchasing and supply executives across roughly 400 industrial companies, it gauges whether operational activity expanded, remained unchanged, or contracted during the preceding month.
Traders monitor the ISM Manufacturing PMI because it serves as an agile leading indicator rather than a backward-looking summary. While hard government data like the industrial production index and upcoming nonfarm payrolls arrive with a notable time lag, survey sentiment offers real-time insight into corporate purchasing behavior.
When factory managers see incoming order pipelines dry up, they reduce inventory orders and scale back hiring weeks before official agency statistics reflect that slump. Historical economic research curated by international bodies like the OECD confirms that national purchasing managers’ surveys correlate tightly with broader business cycles.
Shifts in manufacturing velocity may precede wider gross domestic product turning points, although the lead time varies. Consequently, surprises in this release frequently trigger sharp adjustments in interest rate forecasts and asset valuations.
How the US ISM Manufacturing PMI Is Calculated and Weighted
Calculating the headline figure relies on a mathematical diffusion formula designed to measure both the direction and breadth of economic movement. The Institute for Supply Management polls supply executives across 18 distinct manufacturing industries, asking whether specific operational metrics increased, stayed the same, or decreased compared to the previous month. Each sub-index calculates the diffusion score by adding the percentage of positive responses to half the percentage of respondents reporting no change.
ISM builds its survey panel by industry, using each industry’s contribution to US gross domestic product, so each industry’s responses reflect its share of the economy. The diffusion formula produces a benchmark fluctuating between 0 and 100, where 50 represents an exact state of neutral balance.
The Five Core ISM Manufacturing Components
The headline purchasing managers’ index is not a single survey question, but rather a weighted composite of five distinct sub-indicators. Each of these five pillars accounts for exactly 20% of the final figure, providing a balanced assessment of factory operations.
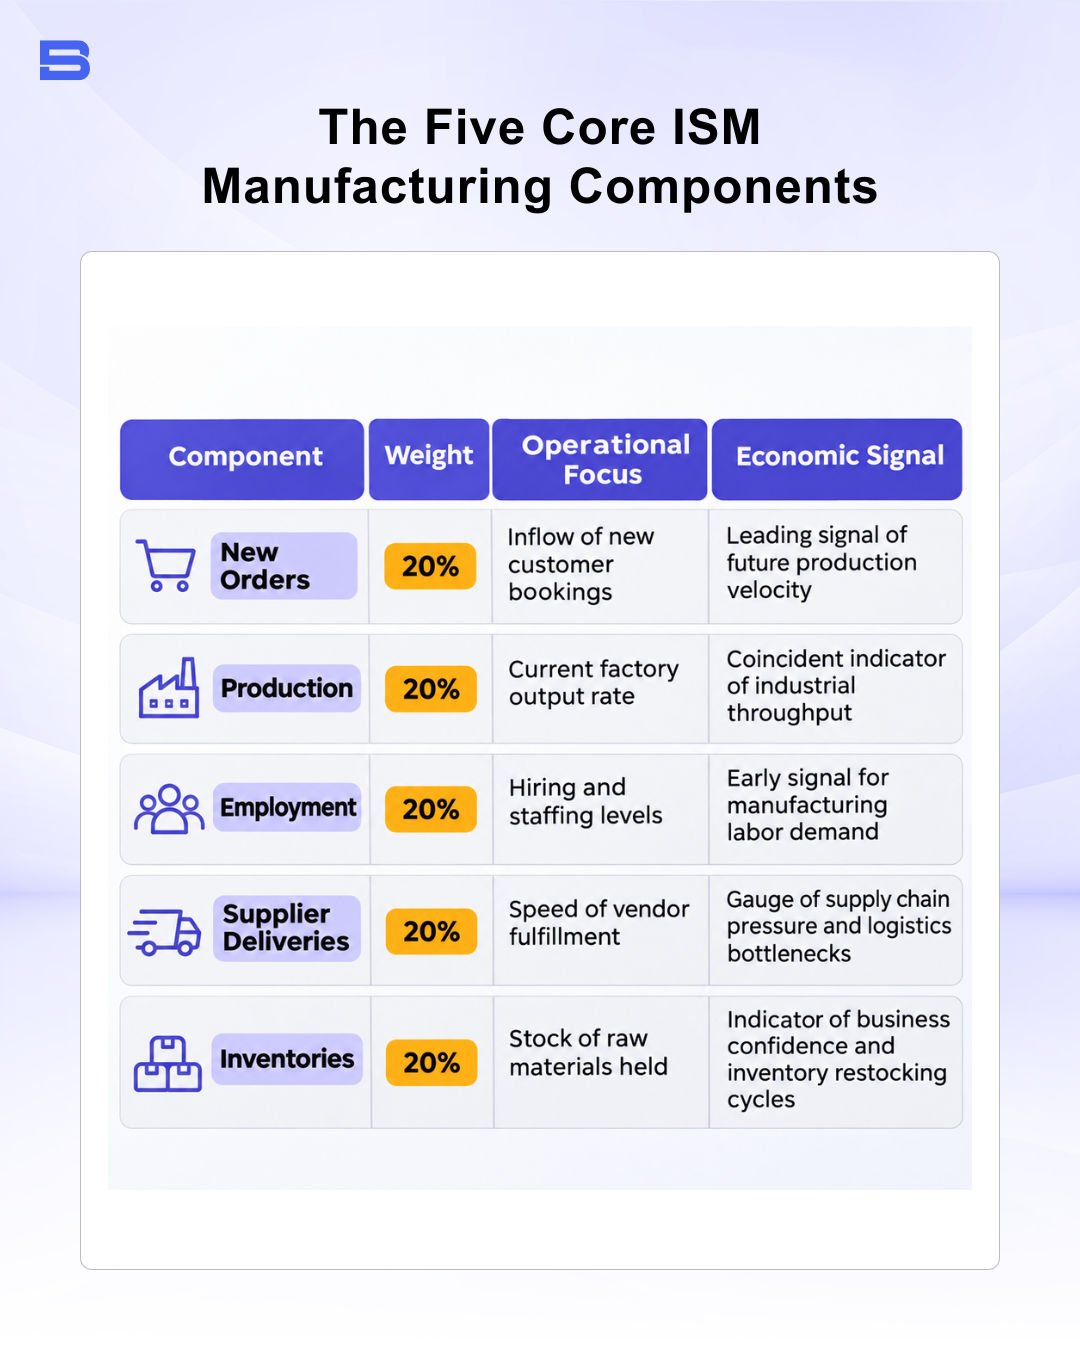
Understanding the unique construction of the Supplier Deliveries component is essential for accurate market interpretation. Unlike the other four sub-indices, slower delivery times produce an index reading above 50 because supply bottlenecks typically occur when aggregate demand overwhelms existing capacity.
However, if supplier delivery times lengthen solely due to port strikes or transit disruptions rather than rising customer orders, the headline PMI can become artificially elevated.
Prices Paid Index and Inflation Signals
Beyond the headline figure, Wall Street analysts scrutinize the ISM Prices Paid Index to anticipate pipeline inflationary pressures. While this metric is excluded from the headline composite calculation, it tracks the month-over-month price changes that purchasing managers pay for raw materials and industrial inputs. Rapid increases in factory procurement costs can filter into wholesale pricing and, eventually, consumer goods.
Because input cost pressures precede retail price tags, this sub-index functions as a useful early warning signal ahead of the monthly US CPI report. When Prices Paid rises sharply while New Orders weaken, markets may price in the threat of stagflationary margin compression for corporate earnings. Conversely, a sustained slump in Prices Paid signals cooling factory cost pressure, which frequently provides monetary authorities with greater flexibility to ease policy.
How to Read the 50 Baseline Threshold and the 47.5 Overall Economy Level
The 50 baseline threshold serves as the primary technical demarcation line between manufacturing growth and contraction. Any headline score above 50.0 indicates that factory activity expanded across the majority of surveyed sub-sectors during the month. Conversely, a print below 50.0 reveals that industrial activity contracted, with lower numbers reflecting a faster pace of deceleration.
Experienced analysts also track a second benchmark from ISM. In its October 2026 report, ISM states that a PMI reading above 47.5%, sustained over a period of time, has generally indicated expansion in the overall US economy. A reading between 47.5% and 50.0% therefore indicates that manufacturing specifically is shrinking, yet the broader US economy and overall gross domestic product are still expanding. A sustained reading below that level has historically been associated with a broad-based macroeconomic contraction.
Context also requires cross-border comparison, as global supply chains remain closely intertwined across export corridors. A sudden slump in US manufacturing demand typically triggers lower production runs for intermediate components across Southeast Asia, which quickly reflects in reports like PMI Malaysia. Evaluating both internal sub-components and international counterparts prevents you from mistaking a temporary regional bottleneck for a global macroeconomic trend.
ISM Manufacturing Index vs S&P Global PMI: Key Differences
Traders frequently notice two competing manufacturing indicators on monthly economic calendars: the ISM survey and the S&P Global (Markit) US Manufacturing PMI. While both reports utilize a diffusion methodology centered on the neutral 50 level, their underlying sampling methods and market impacts diverge significantly.
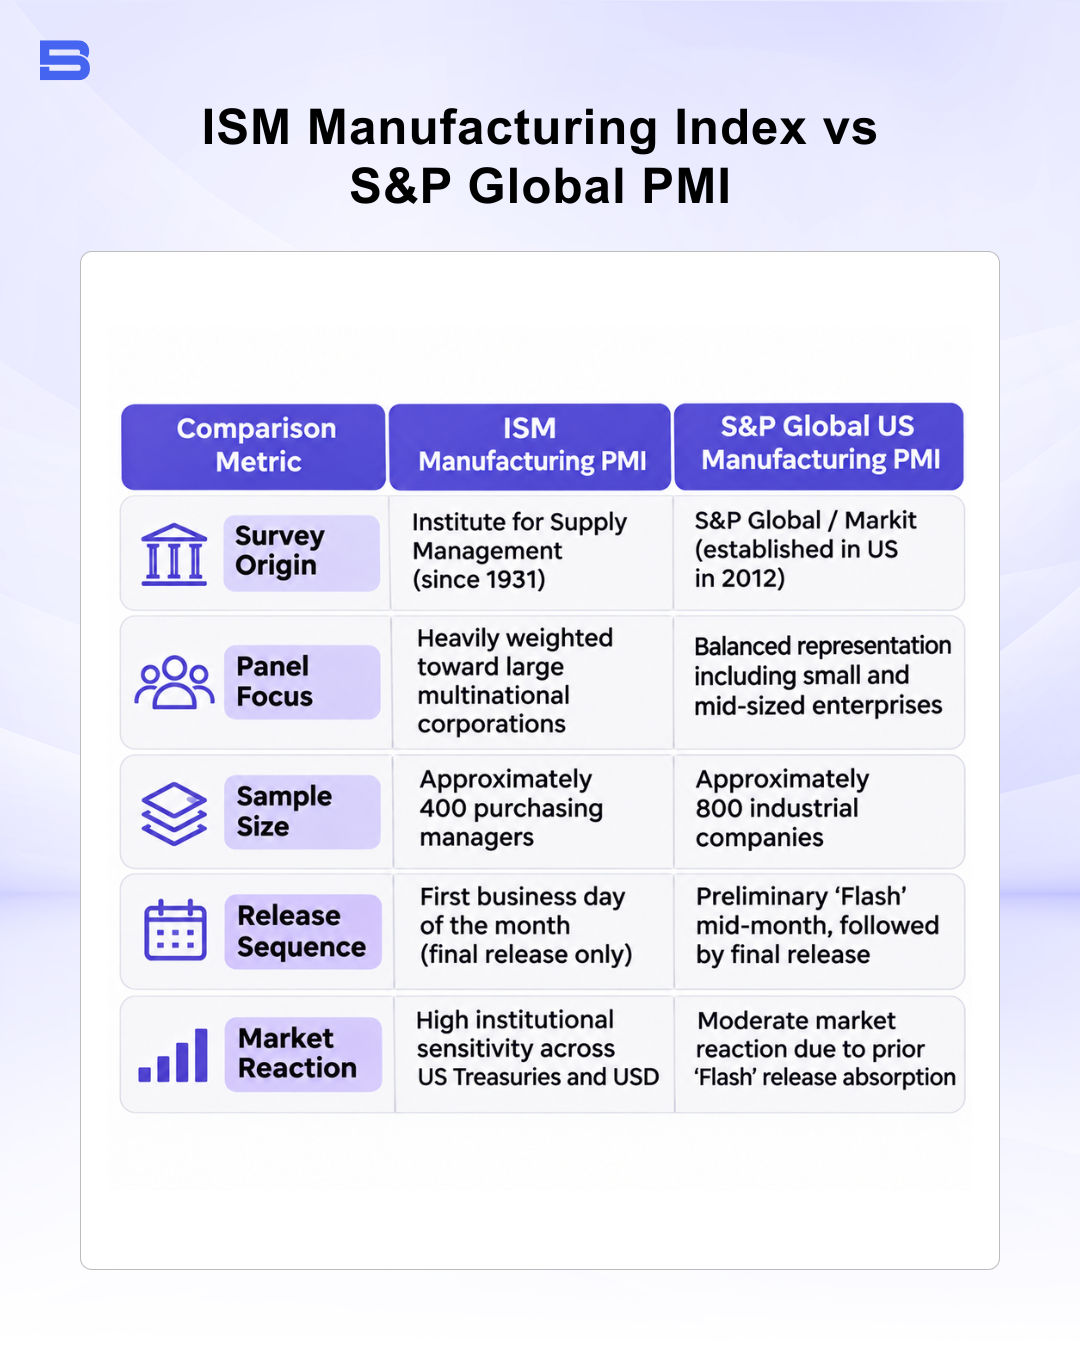
Institutional desks often treat the ISM report as a major market-moving event because of its extensive historical track record and its focus on larger companies. Furthermore, because S&P Global releases a preliminary Flash estimate two weeks earlier, much of its data is already discounted by investors by the time the final figure appears. The ISM report provides fresh, unpriced data that frequently forces immediate positioning realignments.
How to Trade ISM Manufacturing PMI Releases in Forex and Equities
Trading this release requires understanding the direct macroeconomic transmission chain connecting headline numbers to asset prices. When the actual PMI significantly exceeds consensus estimates, traders may price out expectations of an upcoming Federal Reserve interest rate cut. Short-term US Treasury yields can rise in response, which may attract capital inflows that lift the DXY US Dollar Index while putting downward pressure on foreign currency pairs across the global forex market.
Consider a concrete scenario on EUR/USD ahead of the 10:00 AM release, with the pair consolidating at 1.0850 and consensus expecting a PMI of 49.5. The actual release unexpectedly prints at 52.0, signaling robust factory expansion and pushing the 2-year Treasury yield up by 8 basis points. Algorithms initiate heavy dollar buying, driving EUR/USD down 35 pips within five minutes to test support at 1.0815.
If you enter a short trade on EUR/USD at 1.0835 after the initial reaction settles, managing risk requires strict trade execution parameters. On a standard 1.0 lot position ($100,000 contract value), each pip represents a value of $10. Placing a protective stop-loss 20 pips above your entry at 1.0855 targets a loss of about $200 if the order fills at that level, while a profit target at 1.0795 offers a potential gain of about $400, establishing a 1:2 risk-to-reward ratio. Slippage can make the actual loss larger.
Leverage amplifies your returns when you catch a sharp trend, but it accelerates capital destruction just as quickly when the market moves against you. Macroeconomic releases frequently induce sudden spread widening and execution slippage, meaning market orders can be filled several pips away from quoted prices.
Market liquidity may thin out momentarily during major data surprises, which is one reason disciplined position sizing and predetermined exit points can be essential.
Looking Beneath the Headline Diffusion Number
Navigating the ISM Manufacturing PMI requires looking beneath headline diffusion numbers to evaluate underlying drivers like New Orders and Prices Paid. A headline beat driven entirely by supplier delivery bottlenecks tells a very different economic story than one propelled by rising end-market demand. By pairing rigorous sub-index analysis with strict risk management, you can interpret factory health objectively without falling victim to knee-jerk market noise.
Disclaimer: The content on this page is intended for educational and informational purposes only. It does not constitute financial, investment, tax, or legal advice, and should not be interpreted as a recommendation to buy, sell, or hold any financial instrument or asset. Trading and investing involve significant risk, including the possible loss of your entire capital. Products such as forex, CFDs, and cryptocurrencies carry additional risks due to leverage, high volatility, and limited regulatory protection in some jurisdictions. Past performance of any financial instrument does not guarantee future results. Any market views, forecasts, or opinions expressed are those of the author at the time of writing and may not reflect current market conditions. Platform features, fees, and regulatory status are subject to change — always verify information directly with the relevant provider or regulator before making any financial decision. BrokerSpecs may receive compensation from third parties featured on this site. Always conduct your own due diligence and consider seeking advice from a licensed financial professional before investing. Portions of this article were prepared with the assistance of AI tools and reviewed by our editorial team before publication.