



Related Tags
You sit at your trading desk watching the countdown tick down on your economic calendar as analysts debate whether the factory economy is expanding or stalling. When the release hits the tape, the numbers cut through market sentiment and survey opinions with physical reality. Understanding how industrial output is measured helps you track macro liquidity, interest rate expectations, and currency trends.
What Does Industrial Production Index Measure? Core Sectors Explained
The industrial production index (IPI) is a monthly macroeconomic metric measuring the real physical output of manufacturing, mining, and electric and gas utilities. Because it tracks physical volume rather than monetary value, inflation does not distort the headline figures.
To evaluate factory momentum accurately, you should understand how the index divides economic activity across its three core components:
- Manufacturing: This sector carries the largest weighting in most industrial economies. It spans durable goods like machinery and automotive assembly, as well as nondurable items like food processing and chemical manufacturing.
- Mining: This segment tracks oil drilling, natural gas extraction, coal mining, and metal ore processing. It highlights primary resource activity and raw material supply cycles.
- Utilities: This component monitors electricity generation and natural gas transmission. Weather patterns frequently drive sharp utility fluctuations during extreme summer cooling or winter heating periods.
By excluding service activities and stripping out pricing changes, the index gives you a direct read on physical economic activity. When corporate optimism runs high but factory output declines, physical volume data helps you identify an underlying cyclical slowdown.
How Is the Industrial Production Index Calculated?
Statistical bureaus calculate the index by combining physical volume measurements with production-worker hours and electrical usage data. These inputs are combined into a weighted index, using methods such as a Laspeyres index (which keeps fixed base-year weights) or a Fisher ideal index (which blends two weighting approaches).
Each industry group receives an assigned weight based on its proportion of total value added in recent benchmark years. When high-tech hardware manufacturing or renewable energy generation expands its economic footprint, agencies update these baseline weights to ensure the index reflects modern structural output.
Evaluating Economic Health: Why Central Banks Watch IPI
Central banks and institutional portfolio managers monitor physical factory output because it serves as a coincident economic indicator, meaning it moves in step with the economy rather than ahead of it. While sentiment surveys track executive opinions, production figures record what assembly plants are actively building and shipping today.
Consecutive months of declining output point to weakening demand across industrial supply chains. This contraction often foreshadows shrinking company profit margins and softer labor conditions. Conversely, accelerating production confirms broad cyclical growth, though sustained pressure on factories risks pushing producer prices higher again.
Rate-setting committees assess factory momentum to evaluate whether borrowing costs are cooling the real economy as intended. A sharp downturn in industrial momentum can prompt central banks to halt interest rate tightening cycles, directly reshaping sovereign debt yields and capital flows.
Capacity Utilization and Why It Matters Alongside IPI
Alongside aggregate volume, statistical agencies publish capacity utilization rates to measure how much of an economy's factory infrastructure is actively running. This metric calculates actual production divided by sustainable potential output.
In the United States, Federal Reserve capacity utilization data puts the long-run average for total industry at about 79% (1972 to 2025). Readings well above that average, such as the 85.2% peak of 1988–89, have historically signaled tight industrial capacity, which can lead to logistical bottlenecks. At those levels, factory overtime costs and freight premiums may push up wholesale prices. In contrast, readings far below the average, such as the 66.5% low of 2009, have typically pointed to excess capacity, inventory overhang, and subdued business capital expenditure.
Industrial Production Index vs. PMI and GDP: Which Signals Trend First?
Macro traders evaluate diverse economic indicators to time broad market cycles. Understanding the chronological relationship between surveys, output data, and national accounts ensures you do not mistake early survey noise for confirmed expansion.
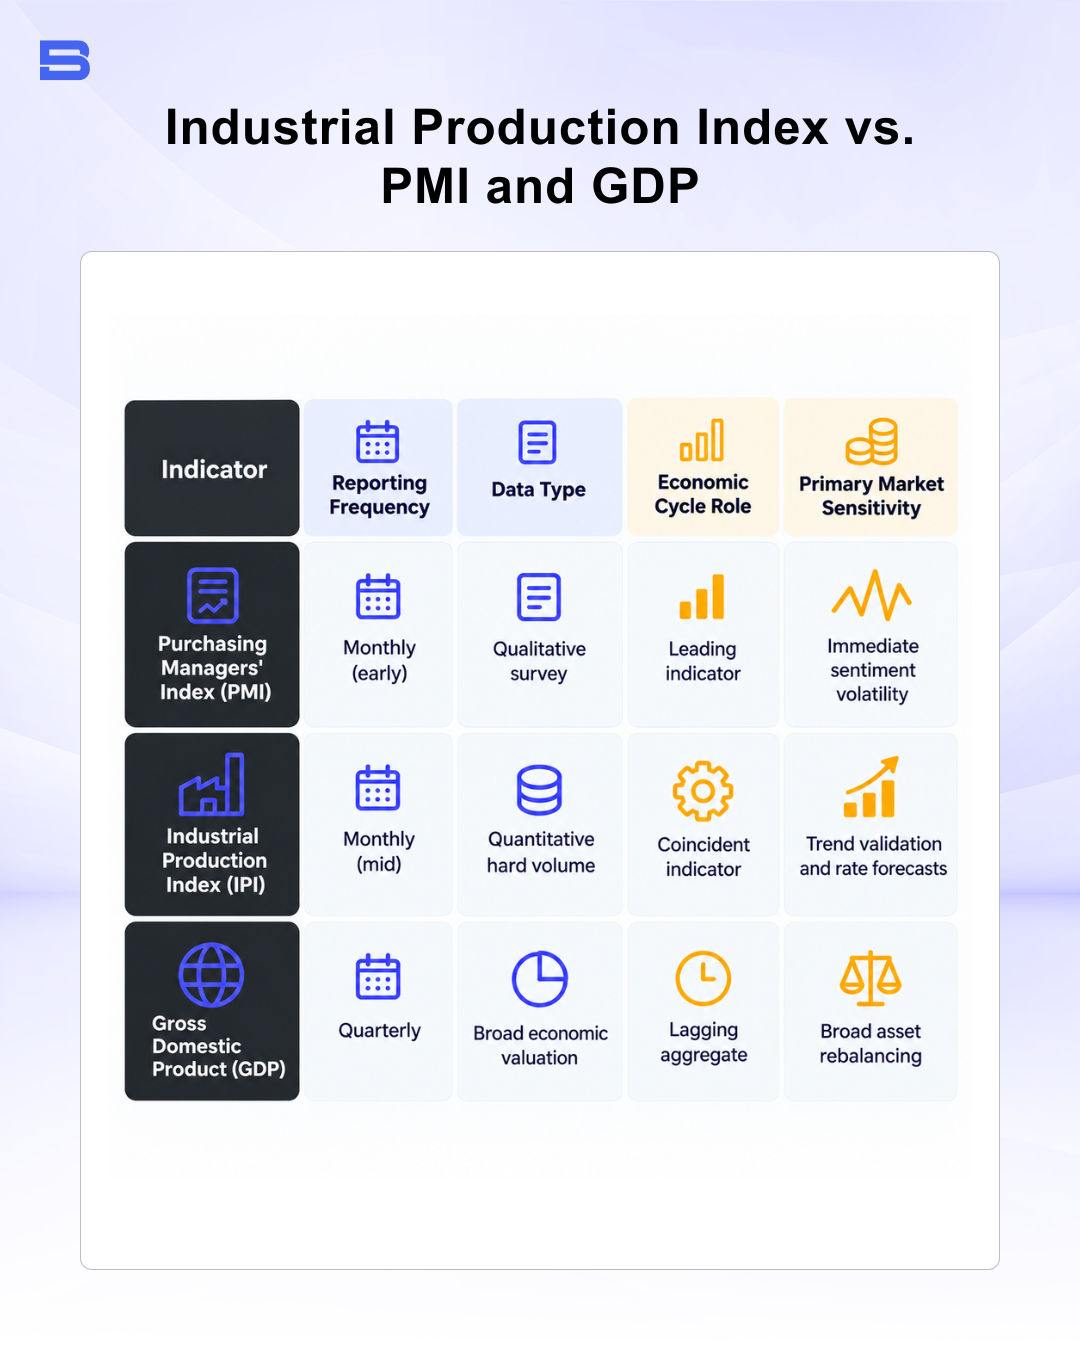
The table below summarizes how the three indicators differ in timing, data type, and role in the economic cycle.
| Indicator | Frequency | Data type | Role in the cycle | Main market impact |
|---|---|---|---|---|
| Purchasing Managers' Index (PMI) | Monthly (early in the month) | Survey-based sentiment | Leading indicator | Immediate sentiment volatility |
| Industrial production index (IPI) | Monthly (mid-month) | Hard data (measured output) | Coincident indicator | Trend validation and rate forecasts |
| Gross domestic product (GDP) | Quarterly | Comprehensive national accounts | Lagging aggregate | Broad asset rebalancing |
Early survey releases such as PMI Malaysia and the US ISM Manufacturing PMI offer early clues regarding purchasing manager sentiment and order book expectations. However, subjective forward-looking responses do not always convert into completed factory orders.
The industrial production index verifies whether earlier managerial optimism materialized on the factory floor. Because this hard data arrives monthly, it helps you anticipate broad structural shifts weeks before comprehensive Malaysia GDP figures are tabulated.
Headline Figures vs. Seasonally Adjusted Data
When an agency publishes monthly output data, the headline year-on-year change often tells a different story than the month-on-month figure. Tracking the seasonally adjusted series helps you spot inflection points ahead of annual averages.
Seasonal adjustments eliminate recurring calendar disruptions, including festive factory shutdowns across Asia or midsummer maintenance closures in Western industrial facilities. As an active trader, prioritizing month-on-month seasonally adjusted numbers enables you to identify emerging shifts, while remaining alert to backward revisions that routinely update initial preliminary reports.
How to Track the Malaysia Industrial Production Index and DOSM Data
If you trade Southeast Asian markets, tracking the Malaysia Industrial Production Index released by the Department of Statistics Malaysia (DOSM) provides useful insight into domestic economic conditions.
The Malaysian index is heavily weighted toward export-oriented manufacturing, with electrical and electronic (E&E) products forming its primary pillar. Mining tracks national crude petroleum and natural gas extraction, while the utility index reflects regional power generation demand.
Because physical factory output drives international trade volumes, robust production growth typically supports Malaysian exports and underpins the valuation of the Malaysian Ringgit (MYR). When global semiconductor cycles soften and domestic manufacturing slows, the resulting compression in trade balances can quickly spill into local equity performance.
How Macro Production Surprises Impact Currency and Equity Markets
Financial markets price consensus expectations into asset valuations long before official statistics cross the newswire. The market volatility you witness around high-impact releases stems primarily from unexpected deviations against median forecasts.
Consider a practical currency scenario. Consensus estimates might project monthly manufacturing output to expand by 0.5%, but the statistical agency reports an unexpected contraction of −1.0%, creating a negative surprise gap of 1.5%.
In a scenario like this, the domestic currency could weaken within seconds as algorithmic traders sell it against foreign counterparts across the global forex market. Industrial and transport stocks may slide on expectations of weaker quarterly revenues, while benchmark bond yields could fall if market participants price in monetary easing.
Attempting to execute trades right as the release prints exposes your account to widened bid-ask spreads and sudden execution slippage. Managing these market events requires disciplined risk management in trading, ensuring position sizes remain conservative enough to withstand rapid macro repricing.
Navigating Output Data with Confidence
Monitoring real industrial production anchors your market analysis in physical economic facts rather than shifting market narratives. Pairing hard production trends with sound risk management allows you to interpret macroeconomic volatility with clarity and protect your trading capital across changing market cycles.
Disclaimer: The content on this page is intended for educational and informational purposes only. It does not constitute financial, investment, tax, or legal advice, and should not be interpreted as a recommendation to buy, sell, or hold any financial instrument or asset. Trading and investing involve significant risk, including the possible loss of your entire capital. Products such as forex, CFDs, and cryptocurrencies carry additional risks due to leverage, high volatility, and limited regulatory protection in some jurisdictions. Past performance of any financial instrument does not guarantee future results. Any market views, forecasts, or opinions expressed are those of the author at the time of writing and may not reflect current market conditions. Platform features, fees, and regulatory status are subject to change — always verify information directly with the relevant provider or regulator before making any financial decision. BrokerSpecs may receive compensation from third parties featured on this site. Always conduct your own due diligence and consider seeking advice from a licensed financial professional before investing. Portions of this article were prepared with the assistance of AI tools and reviewed by our editorial team before publication.