



Related Tags
You are watching your trading terminal at 9:59 AM as the countdown ticks toward a major data release. Spreads on the US Dollar widen across institutional books while algorithmic engines prepare for the print.
Moments later, the release flashes across the wire, triggering immediate volume spikes across currency pairs, equity futures, and Treasury yields. That sudden surge in market volatility is frequently sparked by shifts in consumer confidence.
What Is the Consumer Confidence Index and How Does It Work?
The consumer confidence index is a survey-based economic indicator measuring household financial optimism, job prospects, and willingness to spend on goods and services.
Published monthly by The Conference Board on the last Tuesday of each month, this benchmark aggregates responses from roughly 5,000 US households. The index uses 1985 as its baseline year, calibrated to a benchmark level of 100. Readings above 100 indicate growing consumer optimism relative to historical standards, whereas readings below 100 signal contractionary caution and defensive budgeting.
Because consumer spending generates nearly 70% of economic output in major developed economies, tracking sentiment offers forward visibility into consumer demand. Macro analysts cross-reference these prints against international benchmarks maintained by the OECD to evaluate cross-border trends. For traders, shifts in this survey serve as an early barometer of future retail sales, corporate earnings, and monetary policy adjustments across leading economic indicators.
Present Situation Index vs Expectations Index: The Two Core Sub-Indices
The headline Consumer Confidence Index is calculated as a composite of two sub-measures that carry different analytical weight. The Present Situation Index accounts for 40% of the overall score, tracking current assessments of business conditions and immediate employment availability. The Expectations Index comprises the remaining 60%, gauging consumer outlook for income, business conditions, and labor prospects over the next six months.
Traders analyze the divergence between these two sub-indices to detect early economic inflection points. When the Present Situation Index stays elevated while the Expectations Index drops sharply below 80, historical cycles often point toward an approaching slowdown. Monitoring this structural gap helps you determine whether consumer enthusiasm reflects current momentum or fading forward demand.
Consumer Confidence Index vs Consumer Sentiment: Understanding the Differences
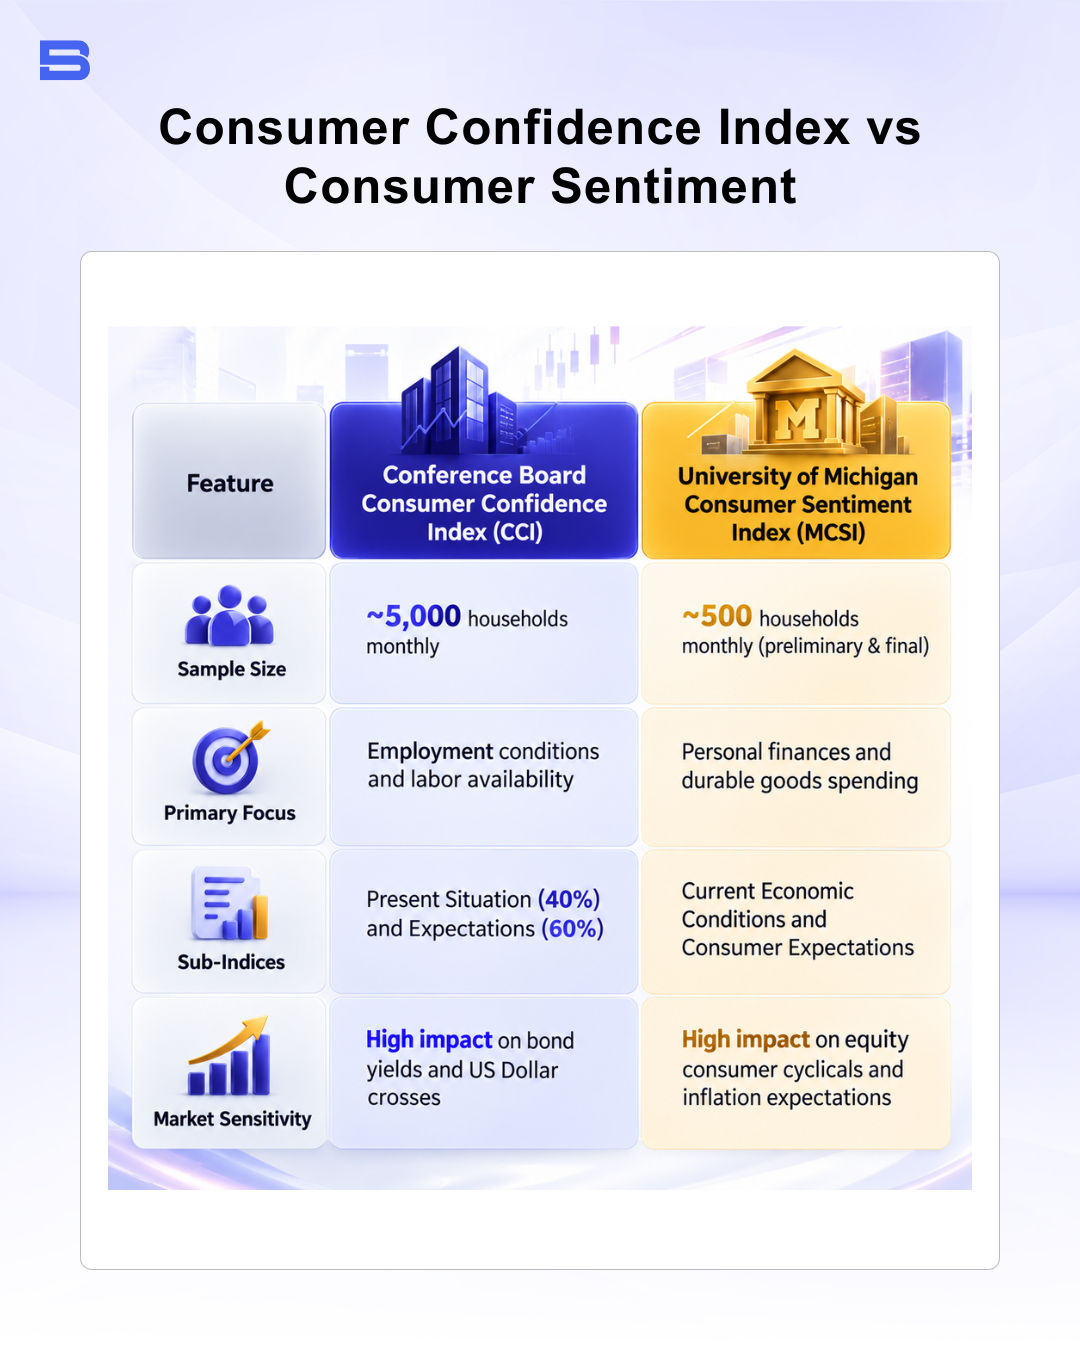
Market participants frequently confuse The Conference Board's metric with the University of Michigan's Consumer Sentiment Index, yet both tools evaluate household attitudes through distinct methodologies. The Conference Board focuses heavily on labor market health and broad macroeconomic conditions, sampling approximately 5,000 households monthly. Conversely, the Michigan survey polls roughly 500 respondents, concentrating primarily on personal finances and durable goods purchasing attitudes.
Because of these structural differences, the two reports can diverge during economic transitions. When labor markets remain robust despite rising prices, The Conference Board's reading often prints higher than Michigan's sentiment gauge. Understanding these methodology nuances prevents you from misinterpreting mixed sentiment headlines across active financial desks.
How Consumer Confidence Index Data Impacts Forex and Stock Markets
Surprise deviations between consensus forecasts and actual survey prints trigger rapid price discovery across liquid asset classes. When headline figures beat expectations, traders anticipate stronger consumer spending and sustained demand, prompting central banks to keep interest rates elevated. This outcome typically strengthens the US Dollar against major counterparts and lifts benchmark government bond yields.
Within equity markets, strong readings encourage sector rotations into consumer discretionary names, industrials, and retail banking stocks. Conversely, sharp downside misses provoke defensive shifts into utilities, healthcare, and safe-haven bonds. In the currency arena, unexpected sentiment swings frequently generate rapid momentum moves across the forex market.
Suppose consensus forecasts project the index at 104.0, but the actual release drops unexpectedly to 98.5, printing a 5.5-point negative surprise. Algorithmic funds sell the US Dollar, driving EUR/USD upward by 45 pips within fifteen minutes as Treasury yields decline 6 basis points. If you entered a long USD position without stop-loss protection, rapid re-pricing could trigger slippage and force unwanted margin depletion.
Comparing Global CCI with the Malaysia Consumer Confidence Index
While global desks prioritize US data releases, regional investors in Southeast Asia monitor domestic sentiment gauges to evaluate emerging market health. In Malaysia, consumer sentiment is primarily tracked through the Consumer Sentiments Index (CSI) published quarterly by the Malaysian Institute of Economic Research (MIER). Unlike the US 1985 baseline, the MIER CSI operates on a 100-point threshold, where numbers above 100 represent expansionary consumer confidence.
Shifts in domestic consumer sentiment directly influence retail activity and corporate borrowing on Bursa Malaysia. Furthermore, persistent sentiment weakness combined with domestic price pressures can affect monetary policy deliberations by Bank Negara Malaysia (BNM) regarding the overnight policy rate (OPR).
Tracking regional sentiment alongside global indices helps traders navigate capital flows affecting both local equities and the Ringgit.
Trading Risks and the Limitations of Consumer Confidence Index Signals
Relying solely on consumer sentiment data introduces significant trading hazards because surveys measure stated intentions rather than realized economic actions. Soft sentiment data can diverge from hard economic reports, such as retail sales volumes or the US CPI. When consumers express pessimism about inflation yet continue spending actively from accumulated savings, trading sentiment alone creates false trend signals.
Economic data releases also generate intense intraday volatility that can trigger rapid whipsaws and stop-loss hunts. Sudden liquidity gaps immediately after announcements often widen bid-ask spreads and increase execution slippage. As emphasized in broader disclosure principles outlined by the U.S. Securities and Exchange Commission (SEC), market volatility requires robust risk controls, disciplined position sizing, and predetermined loss limits on every trade.
Treating Sentiment as a Soft Signal, Not a Trigger
Consumer confidence provides a valuable macro window into household spending dynamics and broad economic trajectory, but it remains a soft survey metric rather than a standalone directional trigger. Combining sentiment prints with hard economic data, disciplined position sizing, and defined risk boundaries enables you to trade market volatility with greater precision and consistency.
Disclaimer: The content on this page is intended for educational and informational purposes only. It does not constitute financial, investment, tax, or legal advice, and should not be interpreted as a recommendation to buy, sell, or hold any financial instrument or asset. Trading and investing involve significant risk, including the possible loss of your entire capital. Products such as forex, CFDs, and cryptocurrencies carry additional risks due to leverage, high volatility, and limited regulatory protection in some jurisdictions. Past performance of any financial instrument does not guarantee future results. Any market views, forecasts, or opinions expressed are those of the author at the time of writing and may not reflect current market conditions. Platform features, fees, and regulatory status are subject to change — always verify information directly with the relevant provider or regulator before making any financial decision. BrokerSpecs may receive compensation from third parties featured on this site. Always conduct your own due diligence and consider seeking advice from a licensed financial professional before investing. Portions of this article were prepared with the assistance of AI tools and reviewed by our editorial team before publication.