



Related Tags
You sit at your trading desk during the Asian market open as headlines flash across the terminal about credit stimulus, municipal bond quotas, and Beijing's fiscal deficit targets. Screen spreads on offshore yuan widen, industrial metals tick lower, and equity index futures shudder across regional exchanges.
Understanding China’s debt dynamics is not just an academic exercise for macro economists. It is a vital lens for managing cross-asset risk across currencies, commodities, and regional equity markets.
When you trade the global forex market or hold international exposure, shifts in Chinese balance sheets ripple into asset pricing worldwide. Headline sovereign metrics often paint an incomplete picture, masking off-balance-sheet commitments and complex state guarantees. Evaluating these metrics with clear eyes helps you separate market panic from structural economic reality.
What Is China's Debt-to-GDP Ratio and How Is It Measured?
The China debt to GDP ratio measures total outstanding debt obligations across the economy divided by nominal gross domestic product over a calendar year. Headline central government debt appears modest on the surface, hovering around 30% of gross domestic product at the end of 2025, according to Ministry of Finance data. However, this narrow measure excludes provincial government liabilities, state-guaranteed investment vehicles, and major state-owned commercial debt.
Institutional authorities measure China's leverage through different analytical lenses depending on the scope of liabilities included. The Bank for International Settlements (BIS) evaluates total credit to the non-financial sector, capturing general government, non-financial corporations, and private households. Under this broader mandate, total non-financial leverage stood at roughly 300% of gross domestic product at the end of 2025.
When assessing these metrics, you must distinguish between on-budget sovereign debt and extended quasi-fiscal obligations. The headline figure measures direct liabilities issued by the Ministry of Finance, whereas macro desks evaluate total public liabilities to gauge genuine sovereign solvency.
Breaking Down China's Total Debt-to-GDP: Government, Corporate, and Household
To understand where pressure points lie, you need to break down the China total debt to GDP figure across its three core economic sectors: government, non-financial corporations, and households. The corporate debt sector accounts for the largest share of leverage, representing roughly 142% of gross domestic product in the third quarter of 2025, according to BIS data.
Much of this debt is concentrated within state-owned enterprises (SOEs) and public industrial groups rather than purely private commercial firms.
Household leverage expanded significantly over the past two decades alongside rapid urban property development. Mortgages and consumer lending pushed household liabilities to roughly 58% of gross domestic product by the end of 2025, according to BIS data. While high personal savings rates offer a buffer against immediate retail insolvency, debt service costs continue to weigh on consumer confidence and domestic retail demand.
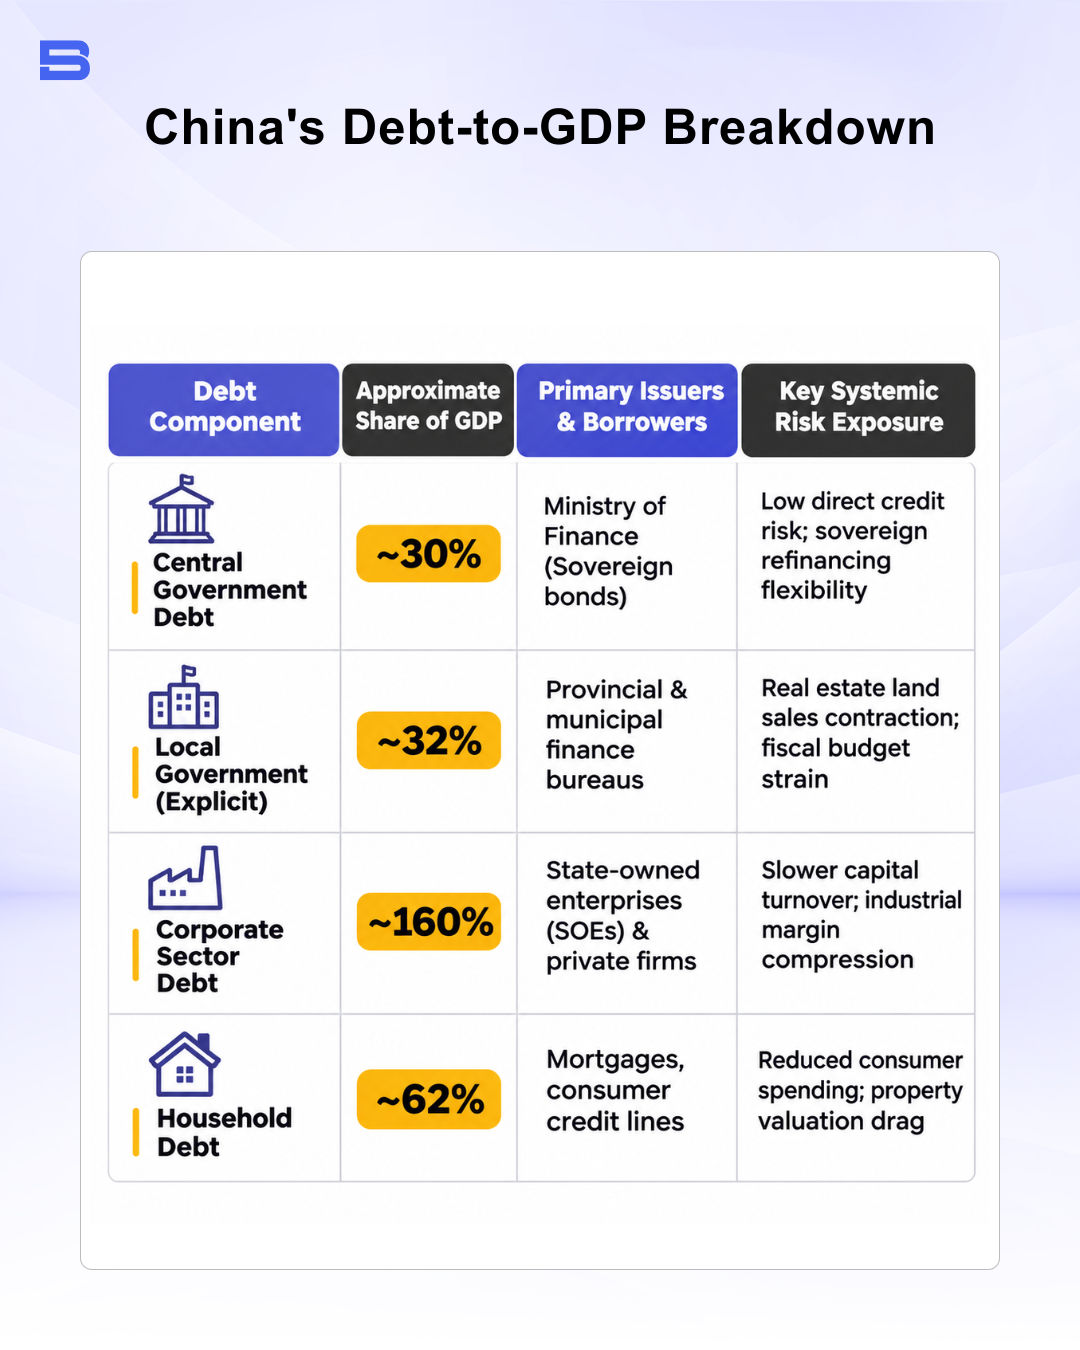
Corporate leverage remains closely intertwined with the banking system, as state commercial lenders hold the overwhelming majority of corporate bonds and bilateral enterprise loans. If state enterprise revenues slow, credit risks do not vanish. They transfer into bank balance sheets.
Augmented Debt and LGFVs: The Hidden Provincial Burden
A closely watched component of Chinese leverage is “augmented debt,” an analytical measure designed by international economists to capture off-balance-sheet obligations.
Local Government Financing Vehicles (LGFVs) were created by regional governments to fund roads, utilities, and infrastructure projects without recording formal public borrowing on provincial balance sheets. These special corporate entities funded capital expenditures by pledging land usage rights and collateralizing local land transfer revenues.
As regional property transactions slowed, municipal land sales receipts contracted, leaving many LGFVs unable to generate sufficient cash flow to cover their bond coupons. According to estimates from the International Monetary Fund (IMF), China’s augmented debt reached roughly 127% of gross domestic product in 2025 when these quasi-fiscal entities are consolidated.
Because municipal entities cannot officially issue standard commercial corporate guarantees, central authorities have had to step in with debt resolution programs to manage rollover risks.
China's Debt vs US Debt: Structural Differences Investors Must Know
Traders frequently compare China debt vs US debt, but their underlying institutional architectures function very differently. The United States carries gross federal debt of roughly 122% of gross domestic product at the end of 2025, funded predominantly through marketable US Treasury bonds purchased by global central banks, institutional pension funds, and private domestic investors. By contrast, China's central sovereign debt ratio is significantly lower, yet its total corporate leverage is far higher than that of corporate America.
The currency denomination of debt is a key structural distinction between the two economies. China's total obligations are almost exclusively denominated in onshore Renminbi (RMB) and held by domestic state-backed financial institutions, which limits external currency mismatches without removing them.
The United States issues global reserve debt, which allows deep international absorption but leaves US Treasury yields vulnerable to capital flows tracked by the DXY US Dollar Index.
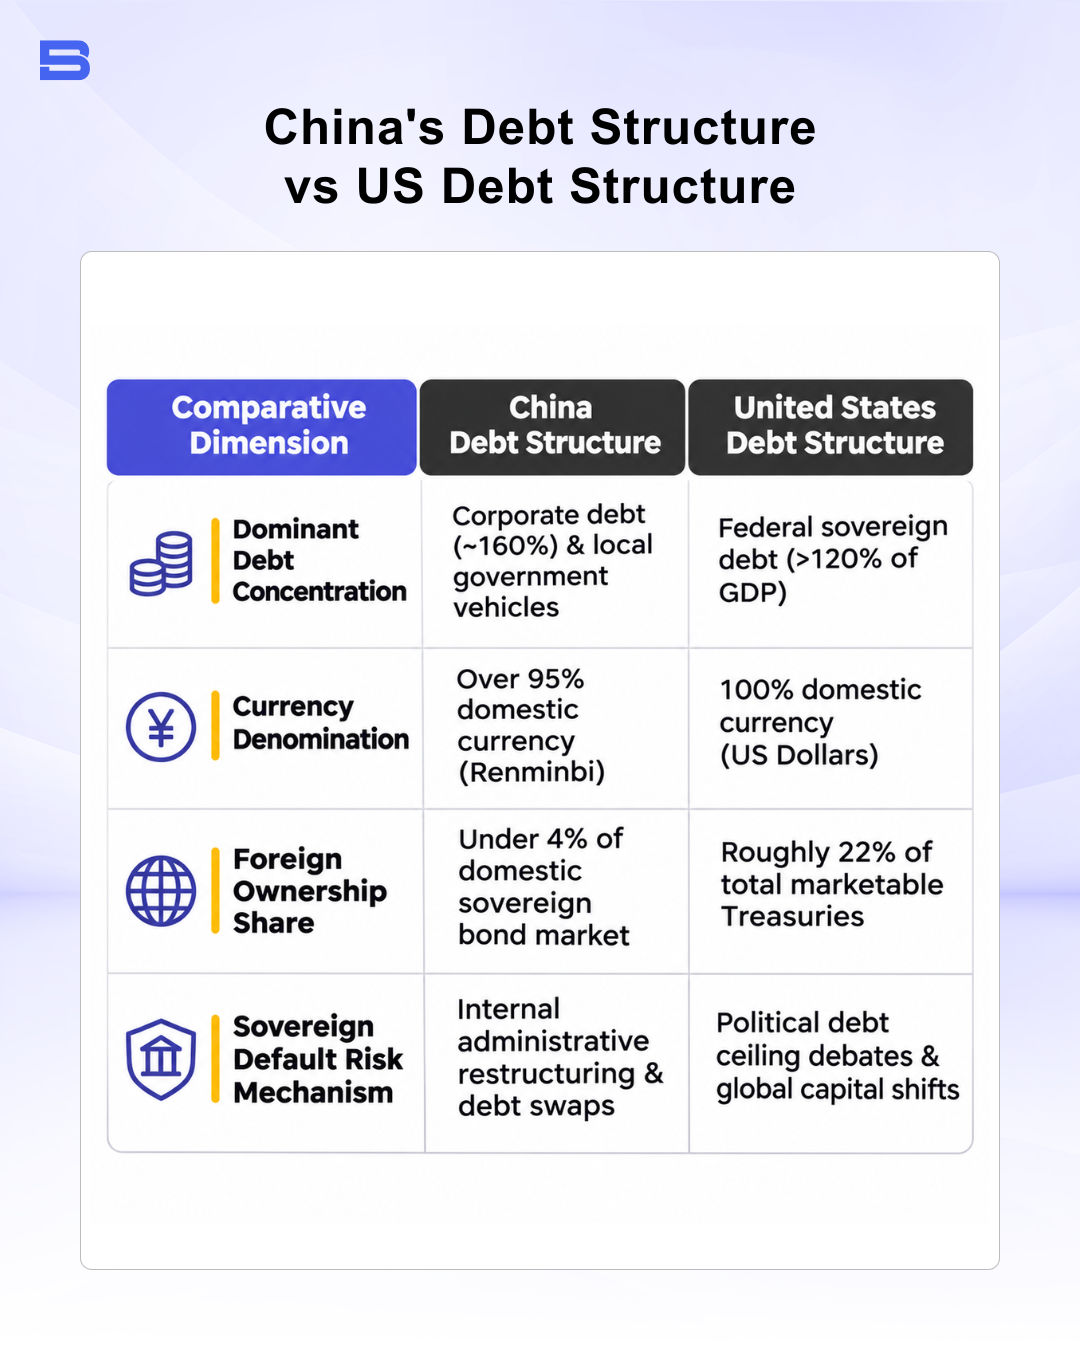
China's domestic funding model grants authorities substantial control over interest rates and bank balance sheets. However, this closed financial feedback loop also means bad loans stay within the domestic system, tying up bank liquidity rather than being resolved quickly through commercial bankruptcy courts.
Policy Responses: Fiscal Swaps and PBOC Monetary Easing
Chinese policymakers have systematically avoided sudden, broad-scale bailouts that could spark reckless speculative borrowing. Instead, the central government uses targeted debt replacement programs, swapping expensive, short-term LGFV commercial paper for low-interest provincial municipal bonds. This transition lengthens maturity profiles, reduces immediate coupon burdens, and transfers opaque shadow debt onto official provincial budget ledgers.
Alongside fiscal debt swaps, the People's Bank of China (PBOC) deploys targeted monetary tools to maintain adequate financial system liquidity. Through reserve requirement ratio (RRR) cuts, medium-term lending facilities, and relending programs, the PBOC supplies low-cost liquidity to commercial banks. This monetary easing supports bank profitability as lenders absorb lower yields on restructured regional government loans.
While these liquidity measures may help prevent systemic credit freezes, prolonged policy easing may put structural downward pressure on domestic interest rates. For active traders, persistent monetary accommodations may alter regional interest rate differentials and influence capital flow dynamics across Asian currency markets.
How China's Debt Burden Impacts China's GDP and Global Markets
China's debt overhang directly shapes the multi-year trajectory of China's GDP by restricting the fiscal multiplier of new credit stimulus. In previous economic cycles, Beijing deployed large-scale capital investments to lift growth rates quickly, but each additional unit of debt now produces diminishing economic output.
As provincial authorities allocate resources toward debt service, capital deployment may shift away from high-growth industrial expansion, dampening broader GDP per capita growth in China.
This structural shift produces distinct transmission channels across international trading assets. Industrial commodities, such as copper, iron ore, and the WTI crude oil price, show intense sensitivity to Chinese infrastructure and property fixed-asset investment data.
When Chinese regional spending slows, commodity demand may weaken, which can soften resource currencies like the Australian dollar while shifting terms of trade for emerging exporters monitored by regional central banks such as Bank Negara Malaysia (BNM).
Consider a macro trader managing currency risk on the offshore Chinese yuan (USD/CNH). Suppose you hold a long position of 1 standard lot (100,000 units of the USD base currency) at 7.2500, requiring a 2% margin ($2,000) under 50:1 leverage. When the PBOC expands regional liquidity to facilitate debt restructuring, the yuan softens by 1,000 pips to 7.3500.
Your gross profit equals CN¥10,000, which translates to approximately $1,360 at the new exchange rate. Leverage amplifies your returns when currency volatility moves in your favor, but sudden fiscal intervention announcements can reverse price action just as quickly, turning paper profits into sharp margin calls if a position is left unhedged.
A Structural Growth Drag, Not a Sudden Crisis
China’s debt challenge appears more likely to act as a structural growth drag than as a sudden systemic solvency crisis. Because the overwhelming majority of obligations are denominated in domestic currency and backed by state-controlled balance sheets, authorities may retain the tools to contain abrupt default risks through fiscal debt swaps and targeted liquidity.
For international investors and active traders, the primary hazard may lie in persistent economic deceleration, compressed industrial margins, and periodic volatility across regional currencies and commodity benchmarks.
Disclaimer: The content on this page is intended for educational and informational purposes only. It does not constitute financial, investment, tax, or legal advice, and should not be interpreted as a recommendation to buy, sell, or hold any financial instrument or asset. Trading and investing involve significant risk, including the possible loss of your entire capital. Products such as forex, CFDs, and cryptocurrencies carry additional risks due to leverage, high volatility, and limited regulatory protection in some jurisdictions. Past performance of any financial instrument does not guarantee future results. Any market views, forecasts, or opinions expressed are those of the author at the time of writing and may not reflect current market conditions. Platform features, fees, and regulatory status are subject to change — always verify information directly with the relevant provider or regulator before making any financial decision. BrokerSpecs may receive compensation from third parties featured on this site. Always conduct your own due diligence and consider seeking advice from a licensed financial professional before investing. Portions of this article were prepared with the assistance of AI tools and reviewed by our editorial team before publication.