



Related Tags
Imagine placing a trade after watching an asset rally, only for the price to hit an invisible ceiling and immediately violently reverse against you. Moments later, your stop-loss triggers, leaving you wondering why the market suddenly changed direction.
In technical analysis, price movements rarely happen at random. They consistently react to specific price zones where buying or selling interest suddenly overwhelms the prevailing trend. These structural boundaries are known as support and resistance.
Understanding support and resistance is fundamental to mastering chart analysis. Rather than seeing these levels as mysterious barriers, successful traders view them as predictable battlegrounds between buyers and sellers where supply and demand balance shifts.
What Is Support and Resistance in Technical Analysis?
Support and resistance represent key psychological price levels on a chart where the balance of power between buyers and sellers shifts dramatically.
- Support: A price level or zone where strong buying demand prevents the asset's price from falling further. As price drops toward support, buyers enter the market while sellers become reluctant to unload, creating a demand floor.
- Resistance: A price level or zone where heavy selling supply halts a rising price. As price approaches resistance, sellers flood the market with supply to lock in profits, while buyers lose interest, forming a supply ceiling.
Market participants often fall into the trap of thinking support and resistance are rigid, single-cent price lines. In real-world trading, market noise and liquidity spikes mean these levels function more accurately as flexible price zones.
Key Level Characteristics
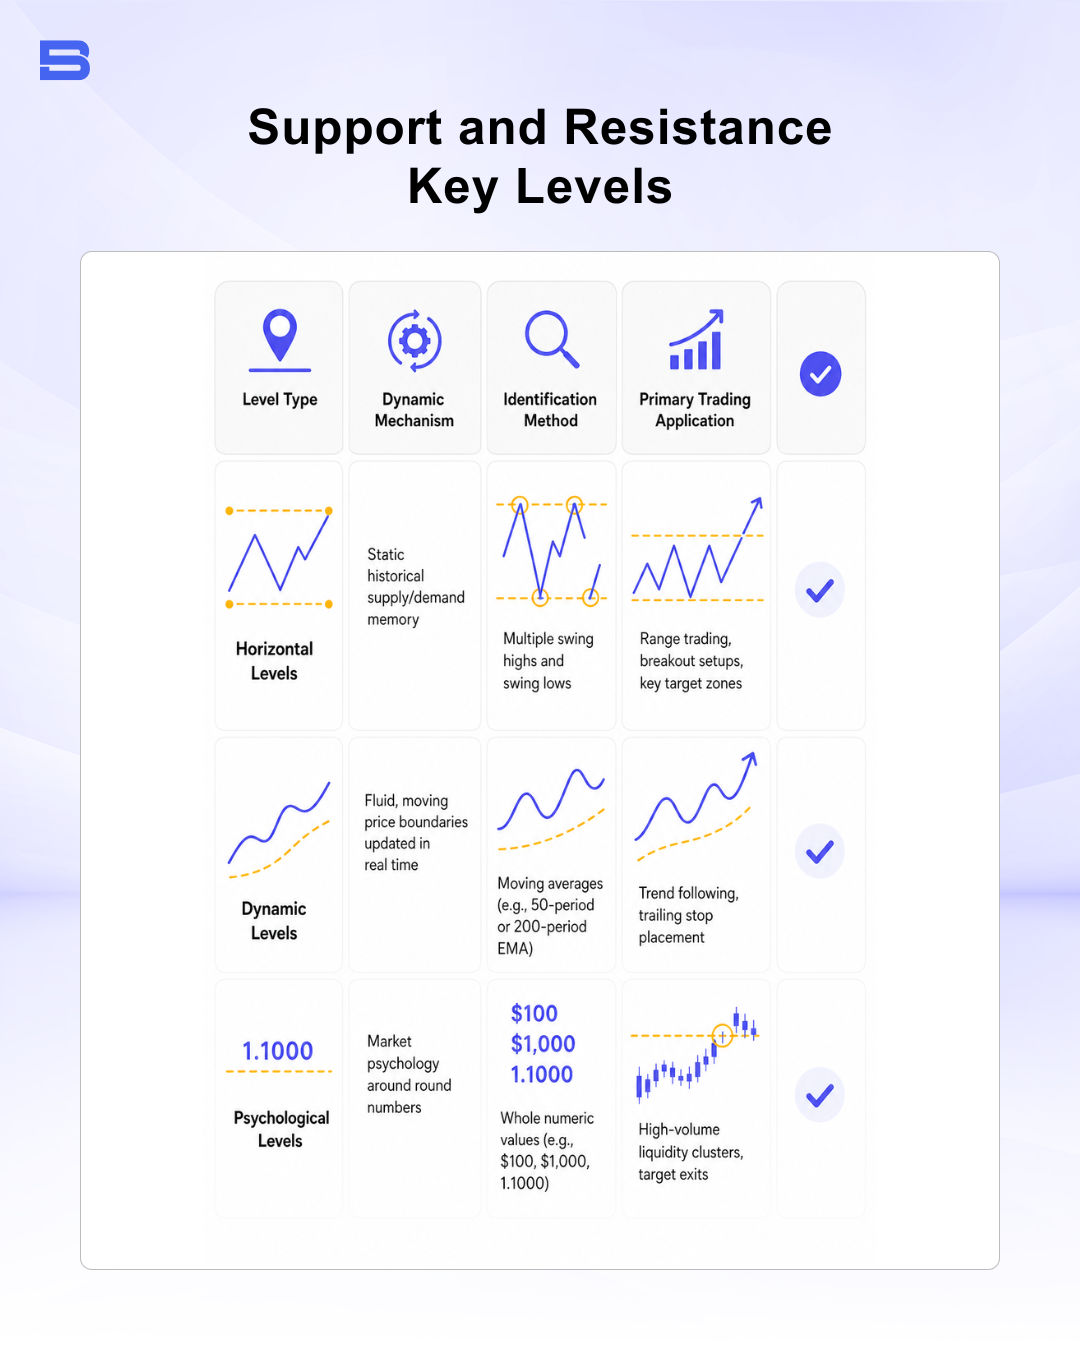 Understanding how these levels interact with historical supply and demand is a foundational skill in technical analysis.
Identifying Support and Resistance Zones on a Candlestick Chart
To effectively spot these levels, you must learn to read raw price action of candlestick charts. Price action creates visual footprint clues through swing highs (peaks) and swing lows (troughs).
How to Draw Accurate Support and Resistance Zones
Drawing precise zones requires distinguishing between noise and genuine market consensus.
- Focus on the Closes, Reference the Wicks: A candlestick wick represents an extreme intra-session price reaction that was ultimately rejected by the market. The candle body represents where market consensus settled. Draw your zones encompassing both the cluster of candle closes and the outer tips of the wicks to capture the full boundary.
- Look for Multiple Touches: A price level tested two or three times carries significantly more validity than a single isolated peak or trough. Every successful test reinforces market memory.
- Use Multiple Timeframes: Identify major levels on higher timeframes (such as Daily or 4-Hour charts) before looking for trade setups on lower timeframes (such as 15-Minute charts). Levels identified on higher timeframes carry far greater market weight.
Validating Price Levels with Volume Profile
Price action alone tells only half the story. Integrating volume profile tools helps confirm whether a price zone holds true institutional interest. High-volume nodes—price levels where substantial trading volume occurred—act as dense support or resistance anchors because institutions actively defend their positions at these average price bases.
Conversely, low-volume nodes allow price to pass through with minimal resistance.
Dynamic Support and Resistance: Using Moving Averages and Indicators
Horizontal levels work exceptionally well in sideways, ranging markets. However, when an asset is in a strong trend, price continuously creates new highs or new lows, making static lines obsolete. In trending markets, traders rely on dynamic support and resistance.
Dynamic Levels via Moving Averages
A moving average smooths out price fluctuations to show the underlying trend line. In an uptrend, moving averages angle upward and act as a dynamic floor where buyers step in on pullbacks. In a downtrend, they angle downward and act as a dynamic ceiling where sellers step in.
- 50-Period Exponential Moving Average (EMA): Widely used by short-to-medium term traders to track dynamic momentum during healthy intermediate trends.
- 200-Period EMA: Represents the long-term structural boundary. Institutional investors closely monitor the 200 EMA; a price rebound off this level often signals a major trend continuation.
Combining horizontal levels with dynamic moving average touches creates powerful confluence, sharply increasing the probability of a successful trade setup.
Support and Resistance Trading Strategies: Bounce vs. Breakout
Traders primarily execute strategies around key technical levels using two primary methodologies: trading the bounce or trading the breakout. These strategies can be applied across various long-term or systematic approaches, including position trading, grid trading, and momentum trading.
The Bounce Strategy (Range Trading)
This approach assumes that an established support or resistance level will hold.
- Long Entry: Buying near support when price shows confirmation of stopping (e.g., a bullish engulfing candlestick pattern).
- Short Entry: Selling short near resistance as price shows exhaustion.
- Risk Control: Place stop-loss orders just beyond the outer wick of the support or resistance zone.
The Breakout Strategy
This approach assumes that when price forces its way through a heavily tested level, momentum will accelerate rapidly as trapped traders exit their positions.
Role Reversal: When Resistance Becomes Support
When price breaks decisively above a resistance level, that former ceiling flips to become a new floor—a concept known as principle of role reversal.
Sellers who went short at resistance are trapped in losses; when price returns to that level, they buy back their positions to break even. Simultaneously, sidelined buyers step in, converting former resistance into new support.
Risk Management: Navigating False Breakouts and Fakeouts
The single largest threat to breakout traders is the false breakout (or fakeout). This occurs when price temporarily breaks past a level to trap aggressive traders before abruptly reversing back inside the established range.
Leverage magnifies both potential gains and losses; a sudden 2% move against a leveraged position during a fakeout can rapidly wipe out a substantial portion of your margin if risk is unmanaged.
To protect your trading capital against fakeouts:
- Wait for Candle Closes: Never trade a breakout while a candlestick is actively forming. Require the candle to close definitively beyond the zone on your primary timeframe.
- Seek Volume Confirmation: Genuine breakouts are accompanied by above-average trading volume. Low volume on a breakout heavily signals a trap.
- Wait for the Retest: Patient traders allow price to break out, reverse to retest the broken level (role reversal), and confirm rejection before entering.
- Enforce Strict Stop-Losses: Always place stop-loss orders outside the full structure zone to avoid being caught in market liquidity sweeps.
Regulatory authorities like the Securities Commission Malaysia (SC) and financial standards bodies like the CFA Institute consistently emphasize that disciplined stop-loss placement and proper position sizing are mandatory to avoid catastrophic drawdowns.
- How to Build an Investment Plan That Actually Works for You?
- What Is the MACD Indicator and How to Use It
- What Is a Wedge Pattern in Trading?
- What Is Ichimoku Cloud Strategy? A Complete Trading System
- Mastering Elliott Wave Theory: Rules and Trading Strategies
- News Trading: Strategies, Execution Risks, and Risk Control
- What Is an Iron Condor Options Strategy?
- Backtesting Explained: What It Is and Why It Really Matters
- Grid Trading: Mechanics, Parameters, and Risk Strategies
- What Is Breakout Trading and How Does It Work?
- Mean Reversion: Technical Strategies and Risk Frameworks
- Momentum Trading: Indicators, Strategies, and Risk Control
- Hammer Candlestick: Structure, Meaning, and Strategy
- Doji Candlestick: Types, Signals, and Trading Strategies
- What Is the Sharpe Ratio and How to Calculate It
- What Is VWAP and How Do Traders Use It?
- Trade the Ascending Triangle: A Step-by-Step Practical Guide
- What Is the Stochastic Oscillator and How to Use It
- How to Trade the Descending Triangle Pattern
- High Frequency Trading: Speed, Algorithms, and Market Impact
- What Is Volume Profile and How to Use It in Trading
- What Is a Morning Star Pattern Candlestick?
- Trade with Parabolic SAR: A Practical Analysis Guide
- Evening Star Pattern: Structure, Rules, and Risk Controls
- Kelly Criterion: Formula, Position Sizing, and Risk
- What Is the NYSE Minimum Trading Price? Rules Explained
Disclaimer: The content on this page is intended for educational and informational purposes only. It does not constitute financial, investment, tax, or legal advice, and should not be interpreted as a recommendation to buy, sell, or hold any financial instrument or asset. Trading and investing involve significant risk, including the possible loss of your entire capital. Products such as forex, CFDs, and cryptocurrencies carry additional risks due to leverage, high volatility, and limited regulatory protection in some jurisdictions. Past performance of any financial instrument does not guarantee future results. Any market views, forecasts, or opinions expressed are those of the author at the time of writing and may not reflect current market conditions. Platform features, fees, and regulatory status are subject to change — always verify information directly with the relevant provider or regulator before making any financial decision. BrokerSpecs may receive compensation from third parties featured on this site. Always conduct your own due diligence and consider seeking advice from a licensed financial professional before investing. Portions of this article were prepared with the assistance of AI tools and reviewed by our editorial team before publication.