



Related Tags
Imagine watching two rival corporate giants whose stock prices have moved together for years suddenly pull apart due to short-term news. While most investors scramble to guess whether the broad stock market is heading up or down, relative-value traders see a mathematical opportunity.
This is where pairs trading comes into play, offering a quantitative framework to isolate asset performance from market turbulence.
What Is Pairs Trading and How Does It Work?
Pairs trading is a market-neutral strategy that involves simultaneously buying an undervalued asset and shorting an overvalued asset. First developed in the 1980s by quantitative researchers at Morgan Stanley, this strategy targets the relative price difference between two historically linked financial assets rather than predicting overall market direction.
When two correlated assets drift apart, a pairs trader bets that their relative prices will eventually move back toward their historical relationship. By taking opposing positions in both assets, your net exposure to broad equity index movements is minimized.
Balancing Long Position and Short Position Exposure
To construct a pairs trade, you establish a long position in the asset that appears temporarily undervalued and a short position in the overvalued asset. If the entire market plunges, the losses on your long leg are offset by gains on your short leg.
Conversely, if the market surges, gains on your long position help offset losses from your short position. This dual-legged structure creates a statistical hedge, protecting your capital against unexpected macroeconomic shocks.
The Core Mechanism: Spread Divergence and Mean Reversion
The price difference between two chosen assets is tracked as a numerical value known as the spread. Under normal market conditions, this spread fluctuates around a stable historical median.
When unexpected news or temporary selling pressure affects one asset, the spread widens beyond normal parameters. Pairs traders monitor this statistical divergence using tools like standard deviation and Z-scores (a measure of how far the spread has strayed from its historical average)to pinpoint overextended levels.
The fundamental engine driving this approach is mean reversion — the statistical expectation that financial ratios eventually return to their historical averages. When the spread reaches an extreme boundary, traders execute orders expecting the gap to narrow back toward equilibrium.
Statistical Arbitrage Explained: Capitalizing on Relative Value
While basic pairs trading focuses on single pairs, institutional funds scale this logic into statistical arbitrage models. Statistical arbitrage uses automated algorithms to scan hundreds of asset combinations simultaneously, identifying micro-inefficiencies across financial markets.
These quantitative systems automatically execute orders when statistical deviations cross predefined thresholds. Individual retail traders can apply similar quantitative principles on a smaller scale by analyzing price ratios and historical relationships.
Testing standards published by bodies like the CFA Institute emphasize rigorous backtesting before deploying automated relative-value models.
Correlation vs. Cointegration in Pairs Trading
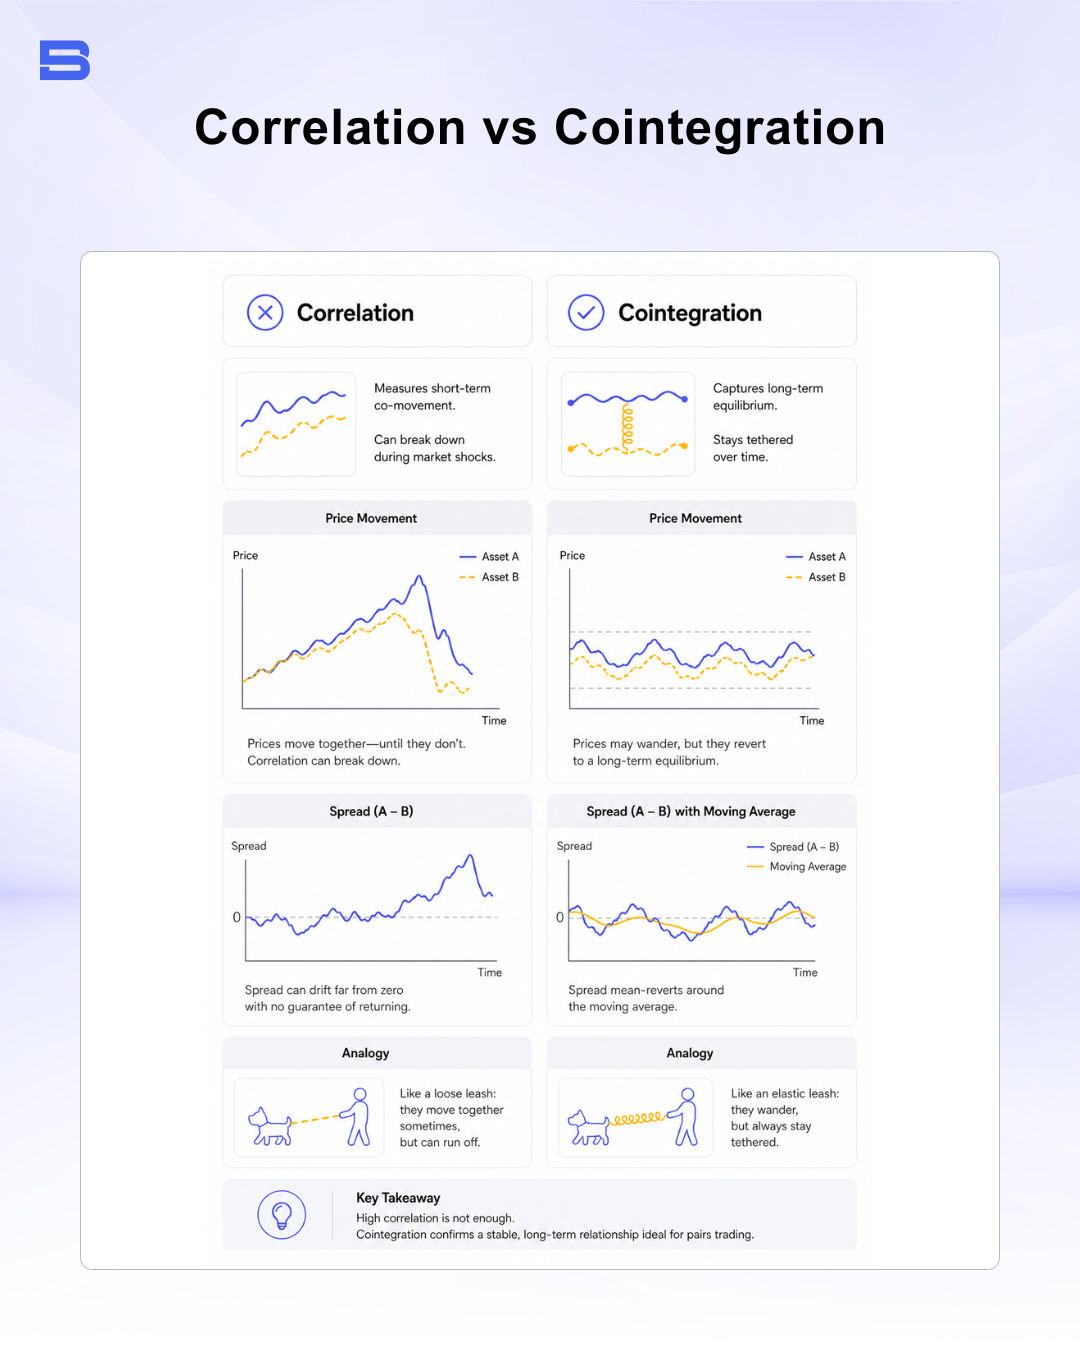
Understanding the difference between correlation and cointegration is critical when selecting assets. Correlation measures whether two assets move in the same direction over a short timeframe, but high correlation can easily break down during market shocks.
Cointegration, by contrast, confirms a long-term equilibrium relationship between two price series. A helpful analogy is a dog owner walking a dog on an elastic leash: while the dog wanders left and right, the elastic leash guarantees they stay tethered together over time.
Technical traders often apply indicators like a moving average to track the moving equilibrium between cointegrated pairs.
Determining Hedge Ratio and Position Sizing
Executing a pairs trade requires calculating a precise hedge ratio rather than simply investing equal dollar amounts. The hedge ratio determines how many shares of Stock B you must short for every share of Stock A you purchase.
For example, if Stock A trades at $50 and Stock B at $25 with a hedge ratio of 2:1, a trader would short 2 shares of Stock B for every 1 share of Stock A purchased long.
Calculating this ratio via linear regression ensures that price volatility between the two legs is accurately balanced. Proper position sizing prevents a more volatile stock from overwhelming the statistical equilibrium of your trade.
Key Benefits of Pairs Trading: Market Neutrality and Built-In Hedging
The primary advantage of this framework is market neutrality. Because your long and short legs balance out directional market risk, overall portfolio performance remains insulated from broad market rallies or crashes.
Built-in hedging allows traders to generate potential returns in bull markets, bear markets, or sideways consolidation. This structural insulation reduces portfolio drawdown and smooths out equity curves over long trading horizons.
Pairs Trading vs. Position Trading
Pairs trading differs significantly from directional strategies like position trading. Position traders buy assets to hold them across long-term trends, exposing their capital directly to market direction.
By contrast, pairs trading focuses strictly on relative value pricing over short-to-medium horizons. Rather than holding assets through macroeconomic cycles, pairs traders exit as soon as the price spread reverts to its statistical mean.
Key Risks and Downside Factors in Pairs Trading
Despite its market-neutral design, pairs trading carries real financial risks. The primary threat is breakdown risk — when historical economic relationships break permanently due to structural corporate changes or insolvency.
Managing short legs also introduces unique borrowing costs. Rules from the US Securities and Exchange Commission (SEC) require strict margin maintenance for short positions, alongside borrowing fees and dividend obligations payable to lenders.
Execution slippage is another operational hazard. Attempting to open two positions simultaneously can lead to price lag, reducing potential profit margins. High-frequency techniques like day trading or short-term swing trading can amplify these execution costs. Traders should avoid doubling down on diverging spreads using high-risk schemes like a martingale strategy.
Exploiting Price Divergences
Pairs trading provides a structured framework for achieving market-neutral relative returns by exploiting statistical price divergence. By pairing long and short positions in cointegrated assets, traders manage directional risk while targeting mean reversion. Success requires rigorous statistical analysis, precise position sizing, and disciplined risk management.
- How to Build an Investment Plan That Actually Works for You?
- What Is the MACD Indicator and How to Use It
- What Is a Wedge Pattern in Trading?
- What Is Ichimoku Cloud Strategy? A Complete Trading System
- Mastering Elliott Wave Theory: Rules and Trading Strategies
- News Trading: Strategies, Execution Risks, and Risk Control
- What Is an Iron Condor Options Strategy?
- Backtesting Explained: What It Is and Why It Really Matters
- Grid Trading: Mechanics, Parameters, and Risk Strategies
- What Is Breakout Trading and How Does It Work?
- Mean Reversion: Technical Strategies and Risk Frameworks
- Momentum Trading: Indicators, Strategies, and Risk Control
- Hammer Candlestick: Structure, Meaning, and Strategy
- Doji Candlestick: Types, Signals, and Trading Strategies
- What Is the Sharpe Ratio and How to Calculate It
- What Is VWAP and How Do Traders Use It?
- Trade the Ascending Triangle: A Step-by-Step Practical Guide
- What Is the Stochastic Oscillator and How to Use It
- How to Trade the Descending Triangle Pattern
- High Frequency Trading: Speed, Algorithms, and Market Impact
- What Is Volume Profile and How to Use It in Trading
- What Is a Morning Star Pattern Candlestick?
- Trade with Parabolic SAR: A Practical Analysis Guide
- Evening Star Pattern: Structure, Rules, and Risk Controls
- Kelly Criterion: Formula, Position Sizing, and Risk
- What Is the NYSE Minimum Trading Price? Rules Explained
Disclaimer: The content on this page is intended for educational and informational purposes only. It does not constitute financial, investment, tax, or legal advice, and should not be interpreted as a recommendation to buy, sell, or hold any financial instrument or asset. Trading and investing involve significant risk, including the possible loss of your entire capital. Products such as forex, CFDs, and cryptocurrencies carry additional risks due to leverage, high volatility, and limited regulatory protection in some jurisdictions. Past performance of any financial instrument does not guarantee future results. Any market views, forecasts, or opinions expressed are those of the author at the time of writing and may not reflect current market conditions. Platform features, fees, and regulatory status are subject to change — always verify information directly with the relevant provider or regulator before making any financial decision. BrokerSpecs may receive compensation from third parties featured on this site. Always conduct your own due diligence and consider seeking advice from a licensed financial professional before investing. Portions of this article were prepared with the assistance of AI tools and reviewed by our editorial team before publication.